Showing posts with label Infrastructure. Show all posts

Tuesday, October 17, 2023

Airport, Debt and Development

An interesting article on Pokhara International Airport, financed with Chinese loans and built by Chinese firms, in the NYT. Key highlights from the article included below: 


The expensive airport, built largely by Chinese companies and financed by Beijing, was a diplomatic victory for China and a windfall for its state-owned firms. For Nepal, it was already an economic albatross, saddling the country with debt to Chinese creditors for years to come.

Nepal had sought to build an international airport in Pokhara since the late 1970s, hoping that it would catapult the city into a global tourist destination. But the project had stalled for decades, mired in political turmoil, bureaucracy and money problems, until China stepped in.

After the airport’s construction, Beijing began declaring that it had been part of the Belt and Road Initiative, President Xi Jinping’s signature infrastructure campaign, which has doled out an estimated $1 trillion in loans and grants around the world. This designation, which Nepal has quietly rejected, has thrust the airport into the middle of a diplomatic tug of war between China and India.

The Pokhara airport highlights the pitfalls for countries that import China’s infrastructure-at-any-cost development model, which spins off money for Chinese firms, often at the expense of the developing country.

In Nepal, China CAMC Engineering, the construction arm of a state-owned conglomerate, Sinomach, imported building materials and earth-moving machinery from China. The airport, built to a Chinese design, is packed with security and industrial technology made in China. Chen Song, China’s ambassador to Nepal, said it “embodied the quality of Chinese engineering.”

But an investigation by The New York Times, based on interviews with six people involved in the airport’s construction and an examination of thousands of pages of documents, found that China CAMC Engineering had repeatedly dictated business terms to maximize profits and protect its interests, while dismantling Nepali oversight of its work. This has left Nepal on the hook for an international airport, at a significantly inflated price, without the necessary passengers to repay loans to its Chinese lender.

In 2011, a year before China officially agreed to lend the money for the airport, Nepal’s finance minister signed a memorandum of understanding to support CAMC’s proposal, before any bidding process had even started. The Chinese loan agreement allowed only Chinese firms to bid on the work. CAMC’s winning bid of $305 million, almost twice what Nepal had estimated the airport would cost, raised the ire of some Nepali politicians, who called the price outrageous and the bidding process rigged. CAMC then lowered the price about 30 percent, to $216 million.

China and Nepal signed a 20-year agreement in 2016; a quarter of the money would be an interest-free loan. Nepal would borrow the rest from the Export-Import Bank of China, a state-owned lender that finances Beijing’s overseas development work, at 2 percent interest. Nepal agreed to start repaying the loans in 2026.

The initial construction budget had earmarked $2.8 million for Nepal to hire consultants to make sure CAMC was abiding by international construction standards, according to documents. As the project went on, the Chinese firm and Nepal lowered that allocation to $10,000, using the money elsewhere.[...]There was also no paperwork ensuring the quality of Chinese-made building materials or information on the Chinese vendors providing the components. [...]The contractor was able to inflate the cost of the project — to double the market rate, by his estimate — and “quality had been compromised.”

CAMC squeezed more money from the project while eliminating oversight. China’s Export-Import Bank, which had provided the loan, had appointed China IPPR International Engineering, a consulting firm, to track the quality, safety and timetable of the construction while ensuring that Nepali officials were satisfied with CAMC’s work. The consulting firm and the construction company are subsidiaries of Sinomach, a machinery giant ranked in the Fortune Global 500. The potential for conflicts of interest became even more pronounced in 2019 when CAMC acquired IPPR, turning it from a sister company into a direct subsidiary. The fees to pay IPPR came from Nepal, as part of its loan from the Chinese bank.

A 2014 feasibility study commissioned by CAMC projected that the airport would be able to repay loans from its profits. That forecast, however, was based on an estimated 280,000 international passengers traveling through the airport starting in 2025. As of now, there are no international flights.

Tuesday, July 6, 2021

Nepal's largest hydropower project starts operation

Nepal's 456 MW Upper Tamakoshi Hydropower Project started operation on July 5, 2021 from one of its six 76-MW units. Nepal will likely have surplus power for now when all the six units start generating power at full capacity (around mid-October 2021). Even during the dry season (December-February), the project can generate electricity at full capacity for five hours. It is a run-of-the-river hydropower project financed through domestic resources. The project incurred huge time and cost overruns (5 years and NRs50 billion, respectively).

Excerpts from The Kathmandu Post:


Energy Minister Bishnu Paudel, speaking during the inauguration, said the full operation of the project is expected to contribute around 1 percent to the GDP. “It will help boost industrial production,” he said. “This project shows that we can collect the fragmented capital within the country and invest in projects like Upper Tamakoshi.”

The majority share (51 percent) of the Upper Tamakoshi Hydropower Limited is held by four public entities, namely, Nepal Electricity Authority, Nepal Telecom, Citizen Investment Trust and Rastriya Beema Sansthan. “The project has boosted our confidence,” said Prime Minister Oli. “We can now develop these types of projects through our own resources and manpower. We ended the loadshedding in 2017 but that was by importing power.” In May 2018, the Nepal Electricity Authority had officially announced elimination of load-shedding for the industrial sector, a year after relieving residential customers who had suffered never-ending power cuts for decades.

[...]The six years project began in 2011 to end the power shortage. But like other projects of national importance, this too suffered, resulting in massive cost and time overruns. Its price tag has swelled, or more than doubled, to Rs85 billion. Bigyan Prasad Shrestha, chief executive officer of the Upper Tamakoshi Hydropower Project, said that the initial cost of the project was Rs35 billion [without interest]. “Now, the cost of the project [without interest] has reached Rs53 billion. According to him, initially, the interest to be paid was estimated at Rs14 billion. “Now, the bank interest alone stands at Rs32 billion. So, the overall cost is around Rs85 billion.” The annual interest rate has been set at 11 percent.

[..]Nepal, currently, has an installed capacity of 1,385 MW of electricity. According to Timilsina, the country’s peak demand stands at 1,350 MW. This means, when all units of Upper Tamakoshi start production, the country will have nearly 500 MW of surplus energy in the wet season. Around 300 MW of power is currently being imported from India.

[...]“With the average power purchase agreement (PPA) rate of Rs4.06 per unit, it is the cheapest price of electricity for Nepal Electricity Authority,” said Ghising. “So, it is beneficial for the power utility. Even after paying back the loans within a few years, it can generate a good amount of income and more power projects can be developed with it.”


Monday, April 5, 2021

Energy sector prospect in Nepal

In an excellent article about energy sector in Nepal in New Business Age, Rupak D Sharma argues that given the large generation capacity in pipeline and the prospect of supply outstripping demand, there is no choice but to export electricity (to India and perhaps Bangladesh) in the short-term and then work to increase per capita electricity consumption over the medium-term. Above all, escalating cost of production needs to be controlled.


[...]A total of 15 new projects built by the private sector added 135.39 MW of electricity to the national grid in the last fiscal year. Two projects of NEA, 60MW Upper Trisuli 3A Hydroelectric Project and 14MW Kulekhani III Hydroelectric Project, also came into operation that year. The energy sector is expected to see an addition of over 800 MW of electricity in this fiscal year alone if the 456MW Upper Tamakoshi Hydroelectric Project comes online. What’s more, 131 additional private sector-led projects with a combined capacity of 3,157.19 MW are under construction. And another 112 private sector-led projects with a combined capacity of 2,124.77 MW are in different stages of development, according to NEA’s latest annual report.

[...]Nepal’s energy generation cost has significantly gone up over the years due to a hike in project development cost. A few years ago, the cost of building a hydroelectric project used to hover around Rs 150 million per MW. The cost has now surged by 33 percent to Rs 200 million per MW. This has made electricity expensive, raising the spectre of restricting domestic consumption and making energy generated in Nepal uncompetitive in the foreign market.

[...]In a typical hydropower project, construction materials, such as cement, steel and aggregates, command a weight of about 40 percent in the total development cost, according to Pradhanang. Labour costs make a contribution of around 20 percent to the total cost, while soft costs, such as engineering design and management, command a weight of 25 percent. The share of the cost of electromechanical items in total project development cost stands at about 15 percent.

Over the years, labour costs have surged as most of the youths have left the country for labour destinations in the Gulf, Malaysia and other countries across the globe, creating a shortage of workers. At the same time, prices of construction materials, such as cement, steel and aggregates, have steadily gone up. Each kg of TMT 500D steel now costs Rs 95, as against Rs 75 two years ago. In India, the same product can be bought for INR 34-47 (Rs 54.4-75.2) per kg in the retail market. Cement is also a lot cheaper in India, where a 50-kg bag of OPC can be fetched for INR 300-350 (Rs 480 to Rs 560). The same quality and quantity of cement costs Rs 700 in Nepal, up from Rs 650 in early 2019.

[...]NEA will be in a position to export 25 to 30 MW of electricity round the clock in the next three months, according to NEA Managing Director Hitendra Dev Shakya. By the upcoming rainy season, that capacity will rise to 450 MW. The portion of surplus energy will continue to rise in the coming years, as NEA has already signed agreements to purchase 5,978.13 MW of electricity from 341 private developers, which is four times the current installed capacity. Nepal will not be able to consume all this electricity in the short run, as its electricity demand currently stands at around 1,500 MW; and it will take several more years to increase domestic consumption. This indicates lots of energy will go to waste if it is not exported.

[...]the Indian government in 2021 issued a procedure for cross-border imports and exports of electricity. The procedure, which has been welcomed by Nepal’s private sector power producers, has finally paved the way for government entities and the domestic private sector to export power to India. [...]Yet one question that many ask is whether India needs Nepal’s electricity as its supply has exceeded demand for over two decades. India currently has an installed capacity of approximately 375,325 MW whereas its peak electricity demand stands at 184,033 MW. Nonetheless, India may want to buy Nepal’s electricity as it generates over 60 percent of its energy through thermal sources such as coal, which are not clean. Since India is looking to migrate to clean sources of energy, Nepal may find a small market to sell its electricity. Lately, there are also talks of selling Nepal’s electricity in the Indian spot power market, where prices are relatively higher.

[...]NEA has reached a conclusion that there is no alternative to exporting power in the short run as the domestic market is not in a position to rapidly enhance its electricity consumption. But in the long run Nepal will have to enhance its energy consumption capacity, as electricity is a raw material and if value is added to it to generate other products the country will be able to generate higher returns.

[...]Even if NEA defaults on 1,000 MW of payments, Rs 140 billion in bank credit will be at the risk of going sour, considering per MW construction cost of Rs 200 million and 70 percent debt facility that banks provide. This amount is over 2.5 times the net profit of all commercial banks in the last fiscal year. Such a huge scale of credit default will not only hit the banking sector, but the entire stock market and the economy.


Monday, February 22, 2021

Key highlights of Nepal's 15th five-year plan (FY2020-FY2024)

National Planning Commission recently published the 15th five-year plan (FY2020-FY2024) taking also into account the effect of COVID-19 pandemic on the government’s priorities and the economy. This plan is considered as a first phase of a 25-year long-term economic vision that aims to position Nepal as a high-income country with per capita income of USD 12,100 by FY2044.  Its theme is 'generating prosperity and happiness' and aims to create the foundation of prosperity and happiness through economic, social and physical infrastructures to accelerate economic growth. 

The government is expecting Nepal to graduate from LDC category to a developing country status within this plan (by 2022 with per capita income of USD 1,400). This plan is expected to contribute to efforts to ensure that Nepal reaches a middle-income country status by FY2030 (with per capita income of USD 2,900) and achieve the SDGs as well. By the end of FY2024, per capita income is estimated to reach USD 1,595.

The plan emphasizes boosting investment in the sectors or thematic issues that are considered as drivers of economic transformation. These include transport, ICT, energy, education and healthcare, tourism, commercialization of agriculture and forest products, urbanization, social protection, subnational economy, and good governance, among others.

 By FY2024, the government wants to achieve a double-digit growth rate, increase per capita income of USD 1,595, reduce population under absolute poverty line to 9.5%, and increase share of formal sector employment to 50%. 

Some of the major national targets for 15th five-year plan (FY2020-FY2024) are as follows:

  • Average GDP growth (at basic prices): 9.6%
  • Average GDP growth (at producers' prices): 10.1%
  • Per capita income: USD 1,595
  • Export of goods and services: 15.7%
  • Share of essential goods (agri, livestock, food items) in total imports: 5%
  • Population under the absolute poverty line: 9.5%
  • Population with multidimensional poverty: 11.5%
  • Share of formal sector employment: 50%
  • Unregistered (formal) establishment: 10% of total establishment
  • Literacy rate (15+ years): 95%
  • Road density: 0.74 km of road per sq km of land
  • Households with access to electricity: 95%
  • Population with access to internet: 80%
  • Electricity generation (installed capacity): 5,820 MW
  • Renewable energy: 12% of total energy consumption
  • Per capita electricity consumption: 700 kwh
  • Agricultural productivity (major crops): 4 MT per hectare
  • Irrigable land with year-round access to irrigation: 50%
  • Per capita tourist spending: USD 100 per day
  • Human development index: 0.624
  • Gender development index: 0.963
  • Population covered by basic social security: 60%
  • Social security expenditure: 13.7% of budget
  • Global competitiveness index: 60
  • Ease of doing business index: 68
  • Travel and tourism competitiveness index: 3.8
  • Corruption perception index: 98
  • Nepali citizens with national ID card: 100%
  • Population affected by disaster incidents: 9.8%
The NPC estimated average growth in agriculture, industry, and services sectors to be 5.4%, 14.6%, and 9.9%, respectively. By the end of the 15th plan, the government is targeting to increase the share of industry and services sectors to 18.8% and 58.9%, respectively, while the share of agriculture sector is to decrease to 22.3%. To achieve the stated average growth rate, the NPC estimated that NRs 9.229 trillion (at FY2019 constant prices and based on ICOR of 4.9:1; FYI, a lower ICOR indicates efficient production process) investment will be required over the plan period. Public, private and cooperative sectors are expected to contribute 39%, 55.6%, and 5.4%, respectively of this required investment.  

[The government is considering FY2019 as a base year for the long-term economic vision. So, the data is presented in FY2019 constant prices. However, this is not much helpful in doing comparative analysis including that of long-term plans and targets. National account estimates, public finance, and periodic surveys - based on which the numbers are estimated eventually- are either presented with different year as base year (FY2011 for NEA for now) or are in current prices (fiscal, monetary, external sectors, and household surveys.]

As a share of GDP by FY2024, the expected impact on macroeconomic indicators are as follows:

National accounts (focused on increasing investment through savings mobilization)
  • Average GDP growth (at producers' prices): 10.1%
  • Per capita income: USD 1,595
  • Export of goods and services: 15%
  • Gross domestic savings: 22%
  • Gross national savings: 47.5%
  • Gross fixed capital formation: 41.6%
Fiscal sector (focused on allocation and implementation efficiency, and fiscal discipline for expenditure management; maximize revenue mobilization and taxpayer-friendly tax administration)
  • Total budget: 43.3%
  • Recurrent expenditure: 17.9%
  • Capital expenditure: 18.6%
  • Financial management: 6.8%
  • Revenue: 30%
  • Income tax: 10%
  • Foreign debt: 5.7%
  • Domestic borrowing: 4.3%
Monetary and external sector (focused on controlling inflation, balance of payments stability, and financial stability)

  • Average annual Inflation: 6%
  • Export of goods and services: 15%
  • Import of goods and services: 49%
  • Remittances: 22.1%
  • Foreign investment: 3%
Meanwhile, the average financing gap to achieve the SDGs is estimated to be NRs 585 billion per year for the entire period of 2016 to 2030 (SDG period). It is on average 8.8% of GDP for 2016-19, 12.3% of GDP for 2020-22, 13% of GDP for 2023-25, and 16.4% of GDP for 2026-30. The overall annual financing gap is estimated at 12.8% of GDP throughout the period of 2016 to 2030.

Monday, January 18, 2021

Hardware and software of economic reforms in India

Subramanian and Felman on the inherited problems, macro-economic stability, and "hardware" and software" of economic reforms (detailed analysis here):


The infrastructure investment boom of the early 2000s ran into major difficulties, especially after the GFC. But bankrupt firms were not allowed to exit, resulting in overcapacity that dragged down profits for the entire sector and led to burgeoning non-performing assets (NPAs) at the banks. This Twin Balance Sheet (TBS) crisis undermined growth because it meant that many firms weren’t sufficiently strong enough to expand—even if they were, banks were reluctant to lend. Real credit growth—the lubricant of any economy—consequently slid to historically low levels, and turned negative in recent years.

Summing up, the government has still not been able to overcome the problems it inherited. Now covid-19 has dealt another blow. Currently, 2020 growth estimates are being upgraded as economies are normalizing, but even revised IMF forecasts are likely to show India’s growth to be amongst the worst in the world. At the same time, macro-economic stability has been set back, as the fiscal position and inflation have deteriorated significantly. So, the RBI forecast that under the baseline scenario, the NPA ratio will almost double to 13.5% by September 2021.

[…] What then needs to be done? Consider why the government’s measures have so far failed to achieve the desired results. Transformational measures always require tweaking to ensure that they work properly. […] One possibility is that the “hardware" of reform measures has not been accompanied by sufficient “software". What is the software of economic reforms? Traversing the sequence from planning to implementation sound policies require accurate data, fair decisions, statecraft to win support, policy consistency over time, and rule of law in implementation.

[…] In the fiscal accounts, despite improvements, increasing off-budget expenditures have rendered the deficit figure less meaningful.

[…] The current government has made extensive efforts to create a level playing field, including a reliance on auctions and use of technology to automate public procurement and tax filing. But certain decisions—in retail, telecom, airports—have been perceived as demonstrating favouritism, reinforced by the reduction in Parliamentary discussion of policy initiatives. Stigmatized capitalism remains a serious problem.

[…] Once a policy is formulated, statecraft is needed to gain support of the stakeholders, especially the states, because nearly every major issue requires joint action.

[…] Once consensus is achieved and a major policy initiative launched, governments need to ensure that subsequent measures remain in line with the strategic objective. Often this does not occur. […] Widening the tax base was set back when in 2019 the income tax threshold was raised dramatically, removing about three-quarters of taxpayers from the tax net.

[…] this government, like all its predecessors, is embroiled in contract disputes with its contractors, especially on infrastructure projects. Its arrears to suppliers run high and there is anxiety about arbitrary tax enforcement.


Monday, August 17, 2020

INR 1 trillion Agriculture Infrastructure Fund in India

On August 9, PM Modi launched the Rs 1 lakh crore Agriculture Infrastructure Fund (AIF) to be used over the next four years. 

This article in Mint explain what it is about: 

The scheme will provide better warehousing and cold storage facilities for farmers, Modi said, adding, new jobs will be created as food processing and post-harvest facilities are set up in rural areas. The scheme will enable startups to scale up their operations and India to build a global presence in organic and fortified food, he said. The fund was launched with ₹1,128 crore of new loans disbursed to more than 2,200 cooperative societies. During the event, the Prime Minister also transferred ₹17,100 crore to farmers under the PM-Kisan direct income assistance scheme.

Under the infrastructure scheme—part of the federal government’s Atmanirbhar Bharat package announced in May—banks and financial institutions will provide ₹1 trillion in loans to cooperative societies, farmer producer companies, self-help groups, entrepreneurs, startups and infrastructure providers. The objective is to provide medium to long-term debt financing for setting up of post-harvest infrastructure and community assets for marketing of farm produce. According to the guidelines, all loans up to ₹2 crore will be disbursed with a 3% interest subsidy. The loans will be disbursed over four years— ₹10,000 crore in 2020-21, and ₹30,000 crore in the next three years.

This article in The Indian Express explains how it will be implemented and the potential roadblocks.

The fund will also be used to provide loans, at concessional rates, to FPOs and other entrepreneurs through primary agriculture credit societies (PACs). NABARD will steer this initiative in association with the Ministry of Agriculture and Farmers Welfare.

“The fund is a major step towards getting agri-markets right,” writes Ashok Gulati, the Infosys Chair Professor for Agriculture at ICRIER. But he points out some missing parts of the puzzle. Firstly, unless NABARD ensures that FPOs get their working capital at interest rates of 4 to 7 per cent — like farmers get for crop loans — the mere creation of storage facilities will not be enough to benefit farmers. “Currently, most FPOs get a large chunk of their loans for working capital from microfinance institutions at rates ranging from 18-22 per cent per annum. At such rates, stocking is not economically viable unless the off-season prices are substantially higher than the prices at harvest time,” he writes. The second missing item is the future of the agri-futures markets. A vibrant futures market is a standard way of hedging risks in a market economy. Several countries — be it China or the US — have agri-futures markets that are multiple times the size of those in India.

Saturday, May 23, 2020

Actual fiscal stimulus in India

On 12 May 2020, Prime Minister Narendra Modi announced a special economic package worth INR 20 lakh crore (INR 20 trillion or about USD 267 billion), which taken together with the earlier announcements by the government and RBI is equivalent to about 10% of GDP, with a focus on a self-reliant India (Atmanirbhar Bharat). On 26 March 2020, the government had announced an economic relief package (PMGKP) worth INR 1.7 lakh crore while the RBI offered liquidity support of INR 3.7 lakh crore in March and INR 2 lakh crore in April. 

The Atmanirbhar Bharat Abhiyan (ABA) has five pillars and will focus on land, labor, liquidity, and laws.
  1. Quantum jump in economy 
  2. Modern infrastructure
  3. Technology-driven system/reforms
  4. Vibrant demography
  5. Strong demand 
The main idea is to build back better so that the eventual economic recovery is better than before and India is better positioned to respond to any future health or natural crises. Some of the measures (such as direct cash transfers and food subsidy) are designed to negate the effect of crisis such as COVID-19. The reform measures will not only enhance efficiency across sectors, but also ensure quality and push India towards a self-reliant economic regime. 

The government is aiming for bold reforms in supply chain in agriculture, rational tax system, simple and clear laws, competent human resource, and a strong financial system. Make in India campaign will benefit from these reforms as the emphasis is on meeting demand locally but competitively. The expectation is that these measures will lead to the emergence of confident and resilient India that depends on its strengths and also integrates with the global economy. 

Following up on PM Modi’s announcement, on 13 May 2020, Finance Minister Nirmala Sitharaman, provided details, in five tranches (Part 1, Part 2, Part 3, Part 4, and Part 5), of the comprehensive package. 

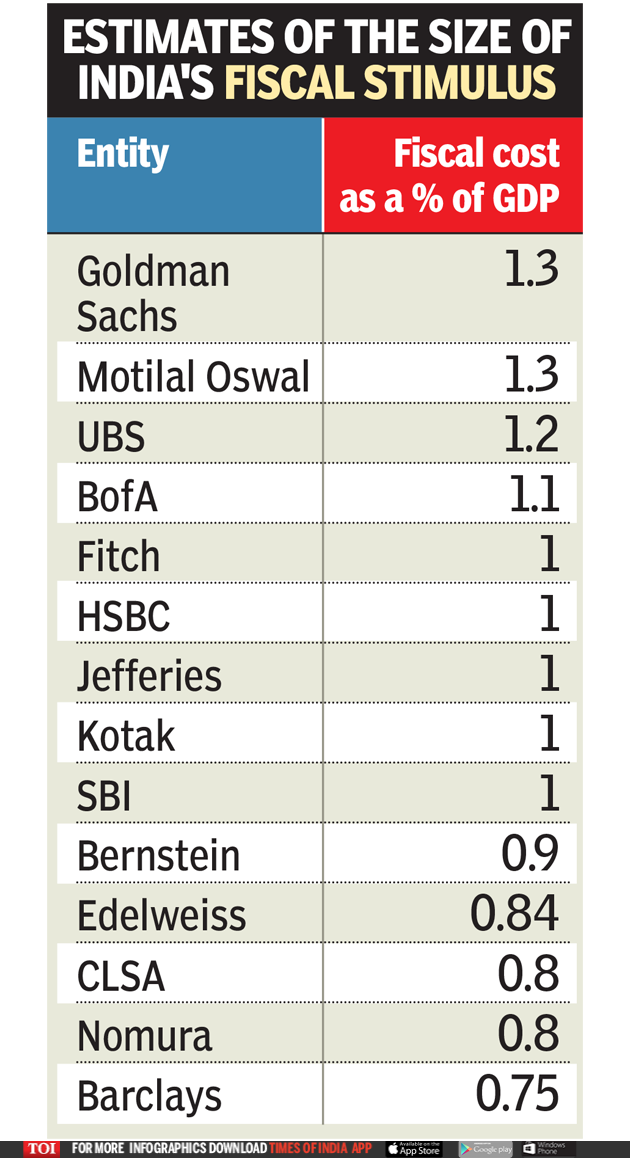
The extra fiscal spending will be a fraction of INR 20 trillion as most are related to providing or leveraging liquidity, providing guarantees, and regulatory tweaks. The guarantees and backstops increase contingent liabilities on government, to the extent they are utilized. The following table gives an overview of the estimated fiscal cost or stimulus (1 USD = INR 75).

Self-reliant India movement economic package
Sectors
INR crores
USD billion
Fiscal stimulus or cost
Before May 13
Revenue loss due to tax concessions since 22 March
7,800
Tax relief
PMGKY
          170,000
22.7
102,600
Emergency Health Response Package
15,000
2.0
15,000
Total
192,800
25.7
Tranche 1-For businesses including MSMEs
MSMEs
Emergency collateral-free working capital facility
          300,000
40.0
Subordinate debt for stressed MSMEs
20,000
2.7
4,000
MSME Fund of Funds
50,000
6.7
10,000
EPF
Extend EPF support for 3 more months
2,500
0.3
2,500
Reduction in employer & employee contribution to 10% from 12% for 3 months
6,750
0.9
Tax relief
NBFCs/MFIs
Special liquidity scheme for NBFC/HFC/MFIs
30,000
4.0
Partial credit guarantee scheme
45,000
6.0
20% of loss if incurred
DISCOMs
Liquidity injection
90,000
12.0
Tax relief
TDS and TCS reduced by 25% for FY2021
50,000
6.7
Tax relief
Total
          594,250
79.2
Tranche 2-For poor, including migrants and farmers
Migrant workers welfare
Free food grains supply to migrant workers for two months
3,500
0.5
3,500
Farmers and small businesses
2% Interest subvention for 12 months for Shishu MUDRA loanees
1,500
0.2
if incurred
Credit facility for street vendors
5,000
0.7
if incurred
Extension of Credit Linked Subsidy Scheme under PMAY (Urban)
70,000
9.3
if incurred
Additional emergency working capital for farmers through NABARD
30,000
4.0
if incurred
Concessional credit to PM-KISAN beneficiaries
200,000
26.7
if incurred
Total
310,000
41.3
Tranche 3-Formalizaiton of Micro Food Enterprise (MFE)
Strengthen infrastructure logistics and capacity building
Agri Infrastructure Fund
100,000

100,000
Formalizaiton of Micro Food Enterprise (MFE)
10,000
10,000
Pradhan Mantri Matsya Sampada Yojana (PMMSY)
20,000
20,000
Animal Husbandry Infrastructure Development Fund
15,000
15,000
Promotion of herbal cultivation
4,000
4,000
Beekeeping initiatives
500
500
TOP to TOTAL
500
500
Total
150,000
20.0
Tranche 4-New horizons of growth- Structural reforms in eight sectors
Social infrastructure VGF
8,100
8,100
Total
8,100
1.1
Tranche 5-Government reforms and enablers
MGNREGS
40,000
40,000
Total
40,000
5.3
RBI measures-actual
801,603
106.9
Grand total
2,096,753
279.6
335,700
Share of total
16.0
FY2020AE NGDP
2,998.6
22489420
Share of NGDP FY2020AE
1.5

When the size of fiscal stimulus is expressed as share of GDP, then one confusion is which year’s nominal GDP to use. If folks use FY2020 advanced estimate of nominal GDP, then it may not be correct because nominal GDP is sure to decline as the advance estimate was released before COVID-19 pandemic. But then, if folks revise FY2020 nominal GDP downward then the size of fiscal stimulus as a share of GDP will increase compared to FY2020 AE. If folks are using FY2021 nominal GDP forecast, then the variability in size of fiscal stimulus is unsurprising. Furthermore, note that some of the fiscal stimulus may not be realized in FY2021 itself. So, expressing fiscal stimulus as a share of GDP is not uniform across estimates by different organizations. That said, most of the estimates are between 1-2% of GDP. 

While some argue that the economic package is inadequate to address the economic challenges, other counter that it is appropriate for the time being