Saturday, September 26, 2015

The 17 Sustainable Development Goals (SDGs)

Here is the list of the 17 SDGs agreed this week at the UN. There are many targets within each group. SDGs are the set of long term global development goals. They succeeded the MDGs.

  1. End poverty in all its forms everywhere
  2. End hunger, achieve food security and improved nutrition and promote sustainable agriculture
  3. Ensure healthy lives and promote well-being for all at all ages
  4. Ensure inclusive and equitable quality education and promote lifelong learning opportunities for all
  5. Achieve gender equality and empower all women and girls
  6. Ensure availability and sustainable management of water and sanitation for all
  7. Ensure access to affordable, reliable, sustainable and modern energy for all
  8. Promote sustained, inclusive and sustainable economic growth, full and productive employment and decent work for all
  9. Build resilient infrastructure, promote inclusive and sustainable industrialization and foster innovation
  10. Reduce inequality within and among countries
  11. Make cities and human settlements inclusive, safe, resilient and sustainable
  12. Ensure sustainable consumption and production patterns
  13. Take urgent action to combat climate change and its impacts
  14. Conserve and sustainably use the oceans, seas and marine resources for sustainable development
  15. Protect, restore and promote sustainable use of terrestrial ecosystems, sustainably manage forests, combat desertification, and halt and reverse land degradation and halt biodiversity loss
  16. Promote peaceful and inclusive societies for sustainable development, provide access to justice for all and build effective, accountable and inclusive institutions at all levels
  17. Strengthen the means of implementation and revitalize the global partnership for sustainable development


The targets within Goal #8 (Promote sustained, inclusive and sustainable economic growth, full and productive employment and decent work for all) are as follows:

8.1. Sustain per capita economic growth in accordance with national circumstances and, in particular, at least 7 per cent gross domestic product growth per annum in the least developed countries

8.2. Achieve higher levels of economic productivity through diversification, technological upgrading and innovation, including through a focus on high-value added and labour-intensive sectors

8.3. Promote development-oriented policies that support productive activities, decent job creation, entrepreneurship, creativity and innovation, and encourage the formalization and growth of micro-, small- and medium-sized enterprises, including through access to financial services

8.4. Improve progressively, through 2030, global resource efficiency in consumption and production and endeavour to decouple economic growth from environmental degradation, in accordance with the 10-year framework of programmes on sustainable consumption and production, with developed countries taking the lead

8.5. By 2030, achieve full and productive employment and decent work for all women and men, including for young people and persons with disabilities, and equal pay for work of equal value

8.6. By 2020, substantially reduce the proportion of youth not in employment, education or training

8.7. Take immediate and effective measures to eradicate forced labour, end modern slavery and human trafficking and secure the prohibition and elimination of the worst forms of child labour, including recruitment and use of child soldiers, and by 2025 end child labour in all its forms

8.8. Protect labour rights and promote safe and secure working environments for all workers, including migrant workers, in particular women migrants, and those in precarious employment

8.9. By 2030, devise and implement policies to promote sustainable tourism that creates jobs and promotes local culture and products

8.10. Strengthen the capacity of domestic financial institutions to encourage and expand access to banking, insurance and financial services for all

8.a. Increase Aid for Trade support for developing countries, in particular least developed countries, including through the Enhanced Integrated Framework for Trade-Related Technical Assistance to Least Developed Countries

8.b. By 2020, develop and operationalize a global strategy for youth employment and implement the Global Jobs Pact of the International Labour Organization

Migration, remittances and balance of payments post April 25 earthquake in Nepal

This is adapted from Macroeconomic Update, August 2015, Vol.3, No.2 (executive summary here, and FY2016 growth and inflation outlook here). It presents is the composition of Nepal’s outstanding internal and external debt. The Macroeconomic Update includes FY2015 update on real, fiscal, monetary and external sector, and growth and inflation outlook for FY2016. It provides a comprehensive macroeconomic assessment, including fiscal sustainability, after the April 25 earthquake.


I. Remittances

Despite the deceleration of remittance inflows till the third quarter of FY2015, the earthquake in the last quarter prompted migrant workers to drastically increase the amount of income remitted to Nepal. Consequently, workers’ remittance inflows reached a record 29.1% of GDP in FY2015, equivalent to $6.2 billion (Figure 1). In US$ terms, remittance inflows grew by 12.2%, marginally up from 11.9% growth in FY2014.[1] This follows a 16.4% growth of migrant workers (those who obtained permits form the Department of Foreign Employment).

Figure 1: Number of migrants and remittance inflows

II. Migration

According to the Department of Foreign Employment, growth of migrant workers decreased by 2.8% (Table 1) against a growth of 16.4% in FY2014 as recruitment process got derailed for over a month and potential migrant workers deferred travel plans in view of the immediate relief and temporary reconstruction works needed in the earthquake affected areas. A total of 512, 887 migrants legally left to work overseas in FY2015 (daily average of 1,405), down from 527,814 in FY2014 (daily average of 1,466). Malaysia, Qatar, Saudi Arabia, and UAE have remained the top employment destinations for low and semi-skilled Nepalese migrant workers (Figure 2). They together accounted for 92% of total migrant workers in FY2015. As a share of total migrants, Malaysia’s share increased from 34.6% in FY2013 to 40.6% in FY2014, but declined to 39.5% in FY2015. Meanwhile, Qatar’s share also decreased from 24.4% in FY2014 to 24.2% in FY2015. Saudi Arabia, Japan and South Korea absorbed higher share of migrant workers when compared to the shares in FY2014.

Figure 2: Destination-wise distribution of labor migrants

Table 1: Monthly out-migration

Number of migrants Y-o-Y growth
mid-month FY2014 FY2015 FY2014 FY2015
August     45,519     42,309 39.3 -7.1
September     24,214     51,551 -13.8 112.9
October     31,959     35,550 -15.9 11.2
November     31,949     43,213 24.7 35.3
December     41,634     53,354 19.1 28.2
January     50,032     45,362 22.4 -9.3
February     37,285     48,941 -0.5 31.3
March     48,552     44,460 24.2 -8.4
April     45,854     52,210 10.1 13.9
May     54,173     31,375 37.9 -42.1
June     54,926     37,962 21.0 -30.9
July     61,717     26,600 22.3 -56.9
Total   527,814  512,887 16.4 -2.8

III. Balance of payments

Despite the weak currency, which improved relative price competitiveness, exports failed to pick up in the first three quarters and then plunged drastically as production got severely affected by the April earthquake and its aftershocks. Merchandise exports (free on board [fob]), in US dollar terms, decreased by 3.9%-- a sharp fall from 5.1% growth in FY2014. The country exported merchandise goods worth $990.8 million, down from $1.03 billion in FY2014. Overall, merchandise exports decreased to 4.6% of GDP in FY2015 from 5.2% of GDP in FY2014. Exports to India, the People’s Republic of China (PRC), and other countries accounted for 65.5%, 2.6% and 31.9%, respectively, of total exports in FY2015.

Merchandise imports growth (cost, insurance freight [cif]) in dollar terms slowed down to 8.0% from 13.9% growth in FY2014 as it got hit due to the severe disruption in economic activities and a slump in import demand following the earthquake. Of the total imports of $7.6 billion, 14.7% was oil imports. In US dollar terms, this is equivalent to $1.1 billion, higher than the value of the country’s total merchandise exports but lower than the oil import bill in FY2014. This is primarily due to the low international oil prices and the weakening of aggregate demand in the last quarter of FY2015. Overall, merchandise imports stayed unchanged at 35.9% of GDP in FY2015 and FY2014. Imports from India, PRC, and other countries accounted for 63.5%, 12.9% and 23.6%, respectively, of total imports in FY2015.

Figure 3: Balance of payments (% of GDP)

The country’s external situation strengthened in FY2015 with the balance of payment surplus reaching $1.5 billion (6.8% of GDP). Though this is an impressive increase from the $1.3 billion (6.5% of GDP) surplus in FY2014, it is still lower than the $1.6 billion (8.2% of GDP) surplus in FY2012 (Figure 3). The large merchandise trade deficit, which reached 31.2% of GDP, was partially[2] offset by workers’ remittances, which reached a record 29.1% of GDP, and export (4.6% of GDP), resulting in a current account surplus of $1.1 billion (5.1% of GDP), up from 4.6% of GDP in FY2014. While capital transfers decreased by 14.3%, financial transfers increased by 57.0% as a result of the 35.5% jump in foreign direct investment, amounted to $44.2 million. Gross foreign exchange reserves increased from $6.8 billion in FY2014 to $8.3 billion FY2014, sufficient to cover 11.2 months of imports of goods and non-factor services.


[1] In local currency, the growth rate was 13.6% in FY2015, down 25.0% growth in FY2014.

[1] Overall, the net goods, services and income balance was a negative 28.3% of GDP, which was offset by net transfers equivalent to 33.4% of GDP, resulting in current account surplus equivalent to 5.1% of GDP.

Friday, September 25, 2015

Recent interest rate trend in Nepal

This is adapted from Macroeconomic Update, August 2015, Vol.3, No.2 (executive summary here, and FY2016 growth and inflation outlook here). It presents is the composition of Nepal’s outstanding internal and external debt. The Macroeconomic Update includes FY2015 update on real, fiscal, monetary and external sector, and growth and inflation outlook for FY2016. It provides a comprehensive macroeconomic assessment, including fiscal sustainability, after the April 25 earthquake.


The persistence of excess liquidity throughout the year pushed short-term interest rates mostly below 1.0%, although the rates were higher after starting February 2015 compared to the corresponding period in FY2014 (Figure 1). The 91-day treasury bills weighted average rate was 0.0004% in mid-August 2014, which jumped to 0.17% in mid-July 2015 and averaged 0.43% in FY2015, higher than 0.13% in FY2014. Similarly, inter-bank rate increased from 0.15% in mid-August 2014 to 1.01% in mid-July 2015, and averaged 1.06% in FY2015, much higher than 0,22% in FY2014. It indicates that the short-term liquidity management measures deployed by the NRB worked in lowering down excess liquidity. However, the persistent and recurring excess liquidity has to be sustainably resolved by address overall investment climate and structural issues in the banking sector.

Figure 1: Weighted average interbank and 91-day treasury bills rate (%)

The weighted average deposit and lending rates fell as the BFIs struggled to boost lending amidst persistence of excess liquidity (Figure 2). The weighted average deposit rate of commercial banks dropped to 3.94% in mid-July 2015 from 3.99% in mid-August 2014. It has fallen consistently from a high of 6.17% in mid-July 2012. Similarly, the weighted average lending rate fell to 9.62% in mid-July 2015 from 10.3% in mid-August 2014. The weighted average interest rate spread stood at 5.7% by mid-July 2015. Base rate continued to decline as well, reaching 7.88% in mid-July 2015.

Figure 2: Weighted average interest rates of commercial banks (%)

The cash reserve ratio (CRR), which is the minimum mandatory deposits that BFIs needs to hold as reserves either in cash or as deposits with the central bank and is usually used as one of the tools to achieve monetary policy goals, has remained unchanged since mid-August 2014. The present CRR for commercial banks, development banks and finance companies is 6.0%, 5.0% and 4.0%, respectively (Figure 3). The bank rate and standing liquidity facility have been kept unchanged at 8%.

Figure 3: Policy rates (%)

Meanwhile, the commercial banks’ have comfortably satisfied the capital adequacy ratio (CAR) and net liquidity requirements. CAR of commercial banks stood at 11.69%, which is 0.69 percentage points higher than the minimum 10% CAR and 1% buffer requirement. Similarly, credit to deposit ratio stood at 77.8% against a maximum limit of 80% and net liquidity stood at 31.8% against the minimum 20% requirement, indicating that there is still room for commercial banks to expand credit and reduce their excess liquidity (Figure 4). Non-performing loans declined to 2.68% of total loan by mid-June 2015 from 3.01% in mid-October 2014. Average productivity sector lending (agriculture, energy, tourism, and cottage & small industries), was 21.88% of total credit by mid-June 2015. Credit to agriculture and energy sectors alone stood at 13.24% of total credit by mid-June 2015.

Figure 4: CAR, net liquidity and NPL (%)

Thursday, September 24, 2015

Nepal’s fiscal performance needs drastic improvement

This is adapted from Macroeconomic Update, August 2015, Vol.3, No.2 (executive summary here, and FY2016 growth and inflation outlook here). It presents is the composition of Nepal’s outstanding internal and external debt. The Macroeconomic Update includes FY2015 update on real, fiscal, monetary and external sector, and growth and inflation outlook for FY2016. It provides a comprehensive macroeconomic assessment, including fiscal sustainability, after the April 25 earthquake.


I. Expenditure Performance

1. The sluggish expenditure in the first three quarters and damages caused by the earthquake in the last quarter of FY2015 significantly affected public expenditure. The budget execution delays, and long-running procedural as well as procurement hassles constrained absorptive capacities[1], resulting in slower capital spending than previous years. After the April earthquake, the institutional and bureaucratic mechanism derailed for about two weeks and then it resumed with a singular focus on rescue and relief operations. This virtually stalled the capital spending related procedural approval, procurement execution, and implementation not only in the earthquake-affected areas, but throughout the country. The estimated actual capital spending was 69.9% of planned capital expenditure in FY2015, lower than the 78.4% achieved in FY2014. Meanwhile, actual recurrent spending was 84.4% of planned recurrent expenditure, marginally lower than the 85.9% in FY2014 (Figure 1). Overall expenditure grew by 13.0%, with recurrent and capital spending growth at 11.0% and 22.3%, respectively— lower than the growth rates in FY2014 (Figure 2).

Figure 1: Absorption capacity (% of planned expenditure)

Figure 2: Growth rate of total, recurrent and capital expenditures (% change)

2. Within recurrent expenditures, compensation of employees increased by 4.1%, grants to local bodies and subsidies[2] by 10.4%, use of goods and services[3] by 8.2% and social security by 48.6%. Overall, recurrent expenditures are estimated to be 15.9% of GDP, marginally higher than 15.6% of GDP in FY2014 (Figure 3).

Figure 3: Recurrent expenditures (% of GDP)

3. Capital spending continued to be sluggish, reaching just 3.8% of GDP against 5.5% of GDP planned for FY2015 (Figure 4). Apart from the slowdown caused by the earthquake in the last quarter, the time when most of the capital spending happens, of FY2015, other persistent factors impeding capital spending are: (i) lack of project readiness, in terms of timely preparatory activities such as detailed project design, land acquisition, establishment of project management offices and required personnel, and procurement plans; (ii) delays in project approval and budget release; (iii) delays in procurement related processes; and (iv) overall weak project planning and implementation capacity[4]. The damage caused by the earthquake in addition to the large investment needed to close the infrastructure deficit has meant that Nepal needs to drastically enhance its capital budget execution performance. Else, the foundations for graduation from LDC category to a developing country status by 2022[5] and the overarching goal to become a middle income country by 2030 will continue to remain weak.

Figure 4: Total, recurrent and capital expenditures (% of GDP)

4. Within capital expenditure although vehicle purchase declined by 31.8%, all other components registered robust growth. But still actual capital spending fell far short of the planned capital spending. Spending on building construction, plant and machinery, and research and consultancy grew by over 90%. Building related capital spending grew by a whopping 286.8%, which could partly be attributed to the low base effect. The expenditure for civil works increased by 113.5%, reflecting slightly better performance than previous years but still requiring further enhancement. Except for civil works— which was 2.3% of GDP, the same as in FY2012 and FY2013— none of the eight sub-categories within capital expenditures was above 1.0% of GDP (Figure 5).

Figure 5: Capital expenditures (% of GDP)

5. As in the previous years, FY2015 saw bunching of spending, especially capital spending, towards the last quarter. Almost one-fourth of actual total public expenditure was done in the last month and 43.9% in the last three months. Of the actual capital spending, 37.8% was spent in the last month and 61.2% in the last three months (Figure 6). This pattern of spending is not much different from previous years, irrespective of the timeliness of issuance of budget. It raises concerns about not only the absorptive capacity, but also the structural issues concerning budget execution.

Figure 6: Monthly spending in FY2015, NRs billion

6. The ballooning recurrent expenditure needs to be rationalized by cutting down subsidies; improving the quality of spending, including operations and maintenance of assets created; weeding out unproductive projects; and reducing the number of priority projects so that more focus is accorded to the strategically important ones. Planning, allocation, delivery, monitoring and evaluation of public sector expenditure must be efficient and productivity-oriented. The urgency also comes from the fact that tax revenue mobilization and its growth rate are marginally higher than recurrent expenditure and its growth rate. Rationalization of recurrent spending will create more fiscal space to boost allocations for capital spending, which needs to be drastically ramped up to create the physical and social infrastructure foundations to accelerate short-term growth and to sustain long-term growth, resulting in an accelerated, high and inclusive growth process.

II. Revenue Performance

7. Total revenue grew by 13.8%, much lower than 20.5% growth in FY2014, reaching NRs405.8 billion (19.1% of GDP). It is lower than the budget target of NRs422.9 billion as the slowdown in economic activities and imports following the earthquake in April hit revenue mobilization. While non-tax revenue grew by 13.0% as opposed to an increase by 20.1% in FY2015, tax revenue growth slowed down to 13.9% from 20.5% in FY2014. Tax revenue and total revenue growth rates have been continuously decreasing since FY2013. As a share of GDP, tax revenue mobilization has improved significantly, reaching 16.8% in FY2015, up from 9.8% of GDP in FY2007 (Figure 7).

Figure 7: Tax and non-tax revenue (% of GDP)

8. The continuous reforms in revenue administration, broadening of the tax base, and the higher import bill (mostly financed by remittance income) resulted in robust revenue performance over the last decade. Some of the notable reforms undertaken in recent years include: (i) information and communication technology based tax returns filing and payments systems; (ii) establishment of a data link with the Company Registrar’s Office to enhance tax compliance[6]; (iii) measures to reduce tax compliance costs; (iv) strengthening of tax monitoring and audit systems; (v) measures to widen the tax net for various tax categories; and (vi) implementation of the Any Branch Banking System (ABBS) for large tax payers.

9. Revenue mobilization from major sources decelerated in FY2015. The growth rates of value added tax (VAT), income tax, customs and excise duty were lower than in FY2015. They grew by 11.3%, 14.1%, 10.1% and 17.9%, respectively. Meanwhile, land registration fee, vehicle tax and health service tax grew by 41.3%, 26.9% and 31.7%, respectively— higher than the growth rates in the previous year (Figure 8). The deceleration in the major sources of revenue is attributed to the economic and imports slowdown following the earthquake. The acceleration in vehicle tax and land registration fee mobilization is due to the higher import of vehicles and land transactions, respectively, in the first three quarters of FY2015. The slower non-tax revenue growth is attributed to the decrease in interest and dividend paid by some public enterprises. Overall, VAT contributed the largest (27.7%) to total revenue mobilization, followed by income tax (22.0%), customs (18.4%), and excise duty (13.2%) (Figure 9). Taxes on consumption and imported goods, which are largely financed by remittance income, constitute a lion’s share of total tax revenue mobilization—around 70%. Furthermore, import-based revenues (custom duties, VAT, and excise on imports only) account for about 45% of total revenue.

Figure 8: Revenue growth (% change)

Figure 9: Composition of total revenue in FY2015

III. Fiscal Balance

10. The lower than expected revenue mobilization along with the disappointing expenditure performance resulted in a fiscal deficit[7] equivalent to about 0.2% of GDP in FY2015 (Figure 10). Though this is better than the fiscal surplus equivalent to 0.7% of GDP in FY2013 and 0.6% of GDP FY2014, it is still lower than the medium-term average fiscal deficit of about 2.2% of GDP. For a low-income country with a large financing need to bridge the infrastructure deficit, particularly in hydropower and transport, running a modest fiscal deficit without jeopardizing fiscal sustainability is desirable. Nepal faces an estimated infrastructure financing gap of between 8-12% of GDP until 2020. The damage wrought by the earthquake and subsequent aftershocks has necessitated the need to ramp up even more productivity-enhancing public spending in physical and social infrastructures.

Figure 10: Fiscal indicators (% of GDP)

11. The total net borrowing amounted to just NRs2.9 billion in FY2015 (0.1% of GDP). Net external borrowing was NRs8 billion, but net internal borrowing was a negative NRs5 billion. The amount of foreign grants is continuously declining since FY2011, when it was 3.4% of GDP against 1.8% of GDP in FY2015, indicating the slow disbursement in projects funded with foreign assistance. This is not ideal given the large investment required not only in infrastructure, education and health sectors, but also in capacity building of public institutions. Furthermore, Nepal has been running a primary surplus since FY2012, meaning that fiscal balance before interest payment on public debt is positive (Figure 11). Combined with the low and declining outstanding public debt, it indicates that the government has ample fiscal space for now to expand productivity-enhancing public capital investment without jeopardizing fiscal sustainability. Box 3 includes further analysis on fiscal sustainability.

Figure 11: Primary and fiscal balance (% of GDP)


IV. Public Debt

12. Nepal’s overall outstanding public debt (external and domestic) has been steadily declining, reaching an estimated 25.6% of GDP in FY2015 (Figure 12). Total external debt decreased to 16.1% of GDP in FY2015 from 17.9% of GDP in FY2014. Similarly, total domestic debt declined to 9.5% of GDP from 10.6% of GDP in FY2014, reflecting the lower than targeted domestic borrowing as a result of the wide gap between actual and planned expenditure. External debt service payments stands at around 8.1% of exports of goods and non-factor services. The declining stock of public debt and debt service payments generally indicate prudent fiscal and public debt management. Nepal’s external debt is mostly on concessional terms and faces low debt distress as per the latest debt sustainability analysis. Box 1 provides further insight on the composition of Nepal’s outstanding public debt.

Figure: 12: Public debt (% of GDP)

V. Public Enterprises

13. The overall performance of public enterprises (PEs) worsened in FY2014 as a result of large losses incurred by Nepal Oil Corporation (NOC) and Nepal Electricity Authority (NEA). The continued mismatch between international price of oil and domestic retail price led to the huge losses of NOC. Similarly, the mismatch between per unit production cost of electricity and per unit selling price resulted in large loss of NEA. However, in FY2015 the net profit of public enterprises is expected to increase drastically, largely due to the huge profit earned by NOC and stable profit of Nepal Telecom (Figure 13). Of the 37 PEs, 15 are expected to make losses in FY2015. As a result of the automatic price adjustment mechanism followed by NOC and continued low international oil prices, including that of LPG cooking gas, NOC is expected to post net profit of NRs18.0 billon (0.85% of GDP) after five years of continued losses. NEA’s losses are expected to increase by twofold to NRs8.5 billion (0.4% of GDP) as the wedge between production and retail price widens. [8] Nepal Telecom is expected to post a marginal increase in profit, reaching NRs11.9 billion (0.6% of GDP).

Figure 13: Net earnings of select public enterprises (% of GDP)

14.. The cumulative liabilities of PEs decreased from 2.5% of GDP in FY2013 to 1.8% of GDP in FY2014 as a result of the decline in both unfunded and contingent liabilities. The unfunded liabilities (salary, pension, social security contribution, health care, and recurrent costs, among others, that the PEs cannot finance themselves) had increased steadily from 1.0% of GDP in FY2009 to 1.6% of GDP in FY2013 and marginally declined to 1.4% of GDP in FY2014. A major contributor to the rise in unfunded liabilities is the hike in salary and allowances in the public sector. Meanwhile, contingent liabilities (state guarantees of loans, defaults of PEs, and clean-up liabilities of privatized PEs, among others) increased in FY2013 after a steady decline in the past four years, but again declined in FY2014. It declined from 0.9% of GDP in FY2013 to 0.5% of GDP in FY2014 (Figure 14).

Figure 14: Unfunded and contingent liabilities (% of GDP)

15.. Either privatization or liquidation of loss making PEs needs to be accelerated to reduce the budget drain. The weak financial position of PEs has led to large unfunded liabilities, especially for pension and other related retirement benefits, which could ultimately become the government’s liabilities. It may be noted that due to the lack of accurate and updated data, the contingent liability of PEs presented here are at best conservative estimates. It is likely that the government is exposed to much higher level of liabilities. In this regard, fiscal and macroeconomic stability could potentially be subject to significant risks. Continuing the adjustment of electricity tariffs and automatic adjustment of fuel prices to reflect the true cost of production will help to lower the losses and liabilities.


[1] Absorptive capacity generally refers to the skills mastered by bureaucracy, state of infrastructure, and quality of institutions.

[2] Subsidies include direct subsidies to non-financial public corporations and private enterprises only. Actual direct and indirect subsidies are much higher. This does not include subsidies for chemical and organic fertilizer, micro-hydropower projects, transportation subsidy for seed and fertilizer supply, and interest subsidies to farmers groups and cooperatives, among others.

[3] Use of goods and services consists of (i) rent & services; (ii) operation and maintenance of capital assets; (iii) office materials and services; (iv) consultancy and other services fee; (v) program expenses; (vi) monitoring, evaluation and travel expenses; (vii) recurrent contingencies; and (viii) miscellaneous.

[4] The Commission for Investigation of Abuse of Authority’s (CIAA) pro-active monitoring of corruption in bureaucracy has also delayed decision making, especially those related to procurement.

[5] For a detailed analysis on prospects for Nepal’s graduation to a developing country status by 2022, see: ADB. August 2013. Macroeconomic Update. Vol.1, No.2, Manila: Asian Development Bank.

[6] The cost of collection per NRs1,000 decreased from NRs16.4 in FY2007 to NRs12.7 in FY2011.

[7] Fiscal balance is computed as expenditures (including net lending) minus revenue (including grants). However, normal fiscal balance (revenue minus expenditure and net financing) was a surplus equivalent to 1.3% of GDP.

[8] The high losses of NEA are also attributed to the rising electricity import, which is sold at suppressed rates, from India, and the still large provisioning for pension and gratuity of employees. The average electricity import price is NRs8.4 per unit, but the retail price is NRs8.04 per unit. Nepal imports around 250 MW of electricity during the dry season.

Sunday, September 13, 2015

Structure of Nepal’s public debt

This is adapted from Box 1 of Macroeconomic Update, August 2015, Vol.3, No.2 (executive summary here, and FY2016 growth and inflation outlook here). It presents is the composition of Nepal’s outstanding internal and external debt. The Macroeconomic Update includes FY2015 update on real, fiscal, monetary and external sector, and growth and inflation outlook for FY2016. It provides a comprehensive macroeconomic assessment, including fiscal sustainability, after the April 25 earthquake.


Nepal’s public debt stock has been continuously decreasing, reaching 25.6% of GDP in FY2015 from a 51.9% of GDP in FY2005. In FY2015, internal and external debt stock amounted 9.5% and 16.1% of GDP, respectively. Much of Nepal’s external debt is on concessional terms. Hence, debt sustainability is not considered at risk.

Nepal’s outstanding public debt (% of GDP)

Source: FCGO

External debt

Nepal’s debt servicing has marginally increased, reaching 3.5% of GDP in FY2015 from 2.7% of GDP in FY2009. Total internal and external principal repayments were 2.2% and 0.8% of GDP, respectively, in FY2015. Similarly, total internal and external interest payments were 0.3% and 0.1% of GDP in FY2015.

Gross debt servicing (% of GDP)

Source: FCGO; NRM staff estimates

Of the total outstanding external debt (NRs343 billion), ADB’s and WB’s share is 41% and 45.3%, respectively. It translates into 6.6% and 7.3% of GDP, respectively, in FY2015. Total debt owed to multilateral and bilateral donors was equivalent to 14.5% and 1.6% of GDP, respectively, in FY2015. It was 19.2% and 3.8% of GDP, respectively, in FY2010. Among bilateral donors, the outstanding debt owed to Japan is 0.5% of GDP, 0.4% for PRC, and 0.3% of GDP for India and South Korea.

Gross outstanding external debt (% of GDP)

Source: FCGO; NRM staff estimates

Of the total loan commitment in FY2015, only 58.5% was disbursed (amounting to about 1.4% of GDP). ADB committed loan amounting to 0.8% of GDP, but only 0.4% of GDP was disbursed. Similarly World Bank (IDA window) committed loan amounting to 1.0% of GDP, but only 0.6% of GDP was disbursed in FY2015. Total disbursement has lagged behind total loan commitment, reflecting the government’s low capital expenditure absorption capacity.

Total loan commitment and disbursement (% of GDP)

Source: FCGO, MOF; ADB staff estimates

Internal debt

The outstanding internal debt increased to NRs201.7 billion in FY2015 (12.4% of GDP) from NRs122.8 billion in FY2009 (9.5% of GDP). Treasury bills accounted for 5.6% of GDP and development bonds 2.7% of GDP. Most of the internal debt is short-term treasury bills (60% of total internal debt) and such funds are used to fund long-term development projects. Ideally, increasing the share of long-term bonds in total internal debt to finance medium to long term investment is desirable. The medium to long term bonds are in the form of national savings certificate, development bonds, citizen saving bonds and foreign employment bonds.

Outstanding internal debt (% of GDP)

Source: FCGO; NRM staff estimates

The gap between internal borrowing target and actual borrowing is widening recently. For instance, in FY2003 the government had a target of borrowing 2.4% of GDP internally, but ended up borrowing 3.1% of GDP. However, in FY2014, the government had a target of 2.3% of GDP, but actual borrowing was just 1.0% of GDP. In FY2015, there was a slight improvement with actual borrowing of 2.0% of GDP against the target of 2.5% of GDP. It again indicates the low expenditure absorption capacity of the government despite having comfortable fiscal space, which could be utilized in financing critically needed physical and social infrastructure that would create the foundation for a high, employment-centric and sustainable inclusive growth, and strengthen economic fundamentals.

Internal target and actual borrowing (% of GDP)

Source: FCGO; NRM staff estimates

Thursday, September 10, 2015

Nepal’s fiscal sustainability and post-earthquake reconstruction

This is adapted from Box 3 of Macroeconomic Update, August 2015, Vol.3, No.2 (executive summary here, and FY2016 growth and inflation outlook here). It includes FY2015 update on real, fiscal, monetary and external sector, and growth and inflation outlook for FY2016. It provides a comprehensive macroeconomic assessment, including fiscal sustainability, after the April 25 earthquake.


The cumulative damages and losses as result of the earthquake and the subsequent aftershocks were estimated at about $7.1 billion. However, the cumulative need for recovery is estimated at $6.7 billion. Excluding housing, total public sector damages and losses (excluding housing) amount to $1.7 billion. The NPC’s estimate of total public sector burden, including housing and human settlement, is about $3.8 billion (or about 18% of FY2015 GDP) over the medium term. The total donor pledge during the reconstruction conference exceeds the total public sector needs for recovery. About 50% of the total pledge is on grant basis.

Given that Nepal needs to borrow a higher amount both internally and externally (cumulatively about 9% of GDP over the next five years) to finance reconstruction projects, and tax revenues being barely sufficient to finance recurrent spending, Nepal’s fiscal policy will need to be more prudent in the coming years.

Outstanding public debt (% of GDP)

Source: FCGO; NRM staff estimates

Nepal has a very low fiscal deficit to start with when compared to regional economies and low and lower middle income economies. In FY2013 and FY2014, robust revenue growth (including grants) along with under-spending of the capital budget resulted in a fiscal surplus. This is not ideal for a low income country with huge infrastructure deficit that is constricting overall economic potential. Nepal needs about 8% to 12% of GDP in annual investment in infrastructural till 2020 to close its infrastructure deficit, accelerate inclusive economic growth, and create increased jobs. Hence, increasing borrowing to a fiscally prudent level to fund productivity-enhancing capital investment will be of paramount importance.

The IMF’s latest debt sustainability analysis[1] shows that Nepal’s risk of debt distress continues to be low, mainly attributed to prudent fiscal policy and low capital budget execution. Public external debt stock and servicing ratios are within the policy-dependent indicative thresholds as government borrowing has mostly been on concessional terms. The analysis shows that debt dynamics remain resilient to standard shocks (shocks to GDP growth, exports, non-debt creating flows [captures a remittance shock], a combination of these shocks, and onetime 30% nominal depreciation shock).

Primary and fiscal balances (% of GDP)


Source: Ministry of Finance; FCGO; NRM staff estimates

Fiscal sustainability over the medium to long term can be assessed by looking at the real interest rate, exchange rate, inflation, GDP growth, and the debt stock.

At present, Nepal’s debt stabilizing primary balance is about -1.2% (Table 3.1), which means that it is the primary deficit required to keep debt to GDP ratio constant at FY2015 level (25.6% of GDP). It assumes a 10% depreciation of the currency against the US dollar (which then increases outstanding debt payment), average real interest rate on total government debt stabilizing at FY2015 level (weighted average of real interest rate on domestic and foreign currency debts), and GDP deflator (proxy for inflation) and GDP growth averaging 7.5% and 5.0%[2], respectively, over the medium term. Alternatively, it indicates that if Nepal judiciously utilizes borrowed money on productivity-enhancing investment projects, it has ample fiscal space (mostly borrowing on concessional terms). In FY2015, primary balance amounted to 1.6% of GDP.


Debt stabilizing primary balance

Initial debt to GDP level

25.6%

Weighted real interest rate

-0.1%

GDP growth rate

5.0%

Required primary balance

-1.2%

Source: NRM staff estimates

Furthermore, even after taking into account the need for higher borrowing to finance public sector investment needs (an additional 10% of GDP cumulatively over the next ten years), the country can still maintain overall fiscal sustainability. It translates into a targeted debt stock of about 35.6% of GDP by 2025 (Figure 3.1), which can be maintained by a combination of the following scenarios:

Scenario 1: (i) primary deficit of 1.2% of GDP till 2019 (assuming that actual disbursement is higher than the previous years) and then 3.1% of GDP till 2025 (disbursement accelerates even higher); (ii) real interest rate of -0.1; and (iii) GDP growth of 4.8% in FY2016; 5.5% in FY2017 and 5.0% till 2025. It assumes GDP deflator of 7.5% and currency depreciation by 10%.

Scenario 2: If the public debt target is increased by five percentage points of GDP only (increasing public debt stock to 30.6% of GDP by 2025 assuming a slower disbursement) then primary balance requirement after 2020 will decrease (maintaining other assumptions as they are in scenario 1).

In addition, if the government’s spending capacity is drastically enhanced, an additional 5% of GDP could be spent in capital projects throughout the country (i.e. not restricted to earthquake-hit areas) to close the infrastructure gap. Incorporating this scenario, the along with the following assumptions would still result in a manageable fiscal situation (a larger primary deficit and cumulative public debt stock of 40.6% of GDP by 2025)

Scenario 3: (i) primary deficit of 1.2% of GDP till FY2017 and then disbursement accelerates much faster than in scenario 1 (reconstruction expenditure amounting to an additional 10.0% of GDP and a further 5.0% of GDP equivalent of expenditure to close infrastructure gap in remaining areas of the country) leading to increase in primary deficit to 4.1% of GDP from FY2018 to FY2025; (ii) real interest rate of -0.1; and (iii) GDP growth of 4.8% in FY2016; 6.0% in FY2017 and 7.0% till 2025 (higher spending accelerates economic growth as well). It assumes GDP deflator of 7.5% and currency depreciation by 10%. Traditionally, countries having public debt of 40% of GDP are considered fiscally sustainable.

Public debt and primary balance estimate (% of GDP)

Source: NRM staff estimates

Overall, Nepal’s average weighted real borrowing rate is much lower than the GDP growth rate, indicating that a small primary deficit would not jeopardize fiscal sustainability. It opens up more fiscal space, which needs to be exploited by the government by enhancing absorptive capacity with respect to productivity-enhancing capital investment, i.e. avoiding inefficient capital accumulation or using such borrowed money to finance recurrent expenditure. The availability of funds for reconstruction should not be an issue. Drastically enhancing absorptive capacity, however, remains an unresolved issue.


[1] IMF. July 2015. Request for Disbursement Under The Rapid Credit Facility— Debt Sustainability Analysis. International Monetary Fund. Washington, DC

[2] Lower GDP growth necessitates higher levels of primary balance to stabilize debt to GDP ratio.

Wednesday, September 9, 2015

Accelerating Post-earthquake Reconstruction for Faster Recovery in Nepal

This is adapted from the issue focus section of Macroeconomic Update, August 2015, Vol.3, No.2 (executive summary here, and FY2016 growth and inflation outlook here). It includes FY2015 update on real, fiscal, monetary and external sector, and growth and inflation outlook for FY2016. It provides a comprehensive macroeconomic assessment, including fiscal sustainability, after the April 25 earthquake.


I. Introduction

A catastrophic 7.8 magnitude earthquake struck Barpak of Gorkha district on 25 April at 11:56 AM. In between numerous aftershocks of below 5 magnitude, two powerful 6.7 magnitude (26 April) and 7.3 magnitude (12 May) aftershocks shook a large part of the country, particularly central and western administrative regions. It caused further damage to the already weakened houses and physical infrastructure, and also triggered numerous landslides in the rural areas. The calamity has added a new challenge to Nepal’s short-to-medium term economic growth and development prospects.

The completion of post disaster needs assessment (PDNA), establishment of a National Reconstruction Authority (NRA) the reconstruction-focused budget and monetary policy for FY2016, and the gradual improvement in political environment have put in place the key prerequisites for the execution of reconstruction programs. Now, effectively operationalizing the NRA along with immediate planning and strategizing of reconstruction projects is critical for ensuring a fast and inclusive recovery. The NRA’s and sector ministries’ ability to swiftly prepare and implement the viable reconstruction projects will be a key determinant for speedy restoration of livelihoods and economic recovery.

The estimated 700,000-982,000 additional people pushed below the poverty line by the earthquake-induced income shock need to be pulled back above the line by providing them with jobs, skills and social protection as appropriate. The post-reconstruction programs need to be well coordinated, ensure ‘building back better’, and be an integral part of the larger goal of meaningful structural transformation of the economy.

II. Damages to lives and property

Over 8,800 were confirmed dead and 22,309 injured. Furthermore, 602,257 and 285,099 private houses were fully and partially damaged, respectively, forcing thousands of people to seek temporary shelter under tents and tarpaulin sheets. Furthermore, 2,673 and 3,757 public buildings were fully and partially damaged, respectively. To prioritize rescue and relief operations, the government declared 14 districts as severely affected (mostly in the central and western regions) although the earthquake has affected 31 of Nepal’s 75 districts.

III. Post disaster needs assessment

According to PDNA estimates, the cumulative damage and loss amount to 33.3% of GDP ($7.1 billion) and the cumulative need for recovery is estimated at $6.7 billion (31.5% of GDP). PDNA was spearheaded by the National Planning Commission with the support of various government agencies, development partners and civil society. It included 21 sectoral and thematic assessments.


Damages, losses and needs ($ billion) 
Sector Included sectors Damage Loss  Total needs
Social Cultural Heritage, Education, Health and Population, Housing and Human Settlements 3.5 0.5 4.0
Productive Agriculture, Financial Sector, Industry and Commerce, Irrigation, Tourism 0.6 1.2 1.2
Infrastructure Communications, Community Infrastructure, Electricity, Transport, Water and Sanitation 0.5 0.1 0.7
Cross-Cutting Gender, Social Protection, Nutrition, Employment & Livelihoods, Disaster Risk Reduction, Environment and Forestry, Governance 0.5 0.3 0.8
Total   5.1 2.1 6.7

Source: National Planning Commission

Of the total estimated recovery needs, about 50% is for rebuilding private housing and settlement. Productive and infrastructure clusters need 17.3% and 11.1%, respectively. These amount to about 5.5% and 3.5% of GDP, respectively. The recovery needs requirement for agriculture, education, electricity, and transport is estimated at $156 million, $397 million, $186 million, and $282 million, respectively. Furthermore, recovery of the tourism sector and restoration of cultural heritage are estimated to require $387 million and $206 million, respectively.

IV. Impact on economy

On 8 June 2015, the Central Bureau of Statistics estimated the macroeconomic impact of the earthquake. GDP growth (basic prices) is estimated to decline by over 1.5 percentage points to 3.0% in FY2015. Pre-earthquake growth estimate for FY2015 was 4.6%. Although the earthquake struck Nepal only in the tenth month of FY2015, the impact on GDP growth is sizable, especially on the services sector.

GDP growth (at basic prices), %

Source: Central Bureau of Statistics

Agricultural sector is expected to grow by 1.9%, industry by 2.7%, and services by 3.9%, down from earlier no-earthquake scenario forecasts of 3%, 3.5%, and 5.8%, respectively. The sharp drop in agricultural output is primarily due to the negative impact of delayed and weak monsoon in the first half of FY2015, and later the loss of livestock due to the earthquake.

The slowdown in the industry sector is due to the drastic drop in quarrying (stones, aggregates, sand and soil extraction slowing down in the affected districts, and the government’s policy to temporarily halt construction activities till mid-July 2015); manufacturing (physical damage, labor shortage, and weak demand); and construction (policy to temporarily halt construction activities, and low production of construction materials, among others).

The disruptions caused by the earthquake have been the most severe in the services sector. Overall, services growth is estimated to decline by about 2.1 percentage points to 3.9% in FY 2015. It grew by 6.4% in FY2014. Wholesale and retail trade; tourism activities (affects air transport, and hotel and restaurant businesses); real estate, renting and business activities; and education sub-sectors are the most affected.

Impact of earthquake on sectoral growth (%)

Source: Central Bureau of Statistics

Wholesale and retail trade grew by 9% in FY2014, but dropped to 3.4% after the earthquake (against the pre-earthquake forecast of 5.6%) in FY2015. This is primarily due to the slowdown in agricultural production and import of goods immediately after the earthquake. Hotels and restaurants suffered due to slowdown in tourist arrivals, physical damage to hotels and restaurants, and decline in domestic tourism. Furthermore, real estate activities were in line with the substantially lower land-related transactions (including buying and selling, renting, and operation of self-owned or leased real estate; and renting of machinery, equipment and personal and household goods). There was also a substantial slowdown in property renting business due to the physical damage to buildings.

Overall, agricultural, industry, and services sectors will contribute 0.6, 0.4, and 2.1 percentage points to GDP growth of 3% (at basic prices) in FY2015, respectively. Nepal’s GDP is estimated at $21.6 billion in FY2015 ($371 million less than what would have been in a no-earthquake scenario). The loss is equivalent to 1.5% of GDP, and about 62% of the total gross value added[1] (GVA) loss is accounted for by the services sector.

Value added output loss by sub-sector in FY2015 ($ million)

Source: Central Bureau of Statistics

Per capita income is estimated to decrease by $23 compared to the no-earthquake scenario (in which case per capita income would have been $785). Accordingly, real per capita income increased by just 0.6% against 3.6% in a no-earthquake scenario.

Nominal per capita GDP (US$)

Source: Central Bureau of Statistics

Inflation was moderating till mid-April 2015, but it started edging up as a result of the supply-side disruptions caused by the earthquake. Prices of both food and non-food items increased in the last three months of FY2015, resulting in an average inflation of 7.2%.

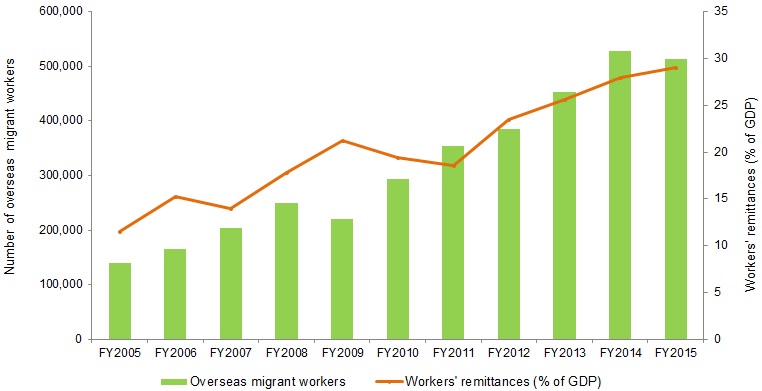
External sector stability remained robust as net transfers increased sharply than the rise in trade deficit, resulting in a current account surplus of 5.1% of GDP and a record foreign exchange reserves ($8.3 billion, which is sufficient to cover 11.2 months of import of goods and nonfactor services). However, this may not be sustained for long as import of construction items is expected to increase drastically in the next few years for the post-earthquake reconstruction programs. Consequently, growth of net transfers may stabilize as migrant workers deplete their present and anticipated savings by remitting early to help households meet immediate needs. Furthermore, remittance inflows may also slowdown if there is less demand for workers in the Gulf countries and Malaysia following the cost-free migration policy[2] implemented by the on July 2015. Hence, the current account balance may slip into the negative territory over the medium term and foreign exchange reserves may deplete to an equivalent of around 7 months of imports, which is also the recommended level of reserve adequacy to ensure external sector stability.[3]

V. Impact on poverty and MDGs

The severely earthquake-affected 14 districts account for about 13.6% of the total number of people living below the poverty line in Nepal. Among them, Dolakha, Makwanpur, Ramechap, Rasuwa, Sindhuli, and Sindhupalchowk have higher poverty rate than the national average of 25.2% in 2011. Similarly, nine have human development index (HDI) score lower than the national average.

Preliminary estimates show that the income shock as a result of the earthquake will likely push an additional 700,000-982,000 people below the poverty line. This translates into an additional 2.5%-3.5% of the estimated population in 2015 pushed into poverty compared to the no-earthquake baseline scenario of about 21%. About 50%-70% will come from rural Central hills and mountains, where the vulnerability prior to the earthquake was already high. The income shock is largely felt through the loss of livelihoods (including death and injuries to primary wage earners) and the loss of housing, productive assets (seeds, livestock, and farm equipment), and durable assets (assorted household items).

Beyond this monetary-based poverty estimates, a larger impact can be expected when factoring in multidimensional poverty, which includes additional factors such as water and sanitation services, disruption of schools and health services, and the possibility of an uptick in food insecurity. The poor and vulnerable are particularly dependent on local infrastructure (roads, bridges, health posts, and schools) for access to labor and commodity markets, and for accumulation of human capital (especially those of children). Reviving local economic activities and resumption of basic public services along with an accelerated implementation of reconstruction projects will be critical to make up for the setback on poverty reduction caused by the earthquake.

Furthermore, the progress towards achieving the Millennium Development Goals (MDGs), on which Nepal was mostly on track prior to the earthquake, is likely to be adversely affected, given the widespread damages to houses, classrooms, and health posts. It will also likely affect the country’s overarching goal to graduate from the Least Developed Country (LDC) category by 2022.

VI. International Conference on Nepal’s Reconstruction

On 25 June 2015, the government organized an international conference on Nepal’s reconstruction. High level representatives from over 50 countries and multilateral agencies participated in the conference.

ADB, represented by its President, Takehiko Nakao, pledged $600 million—including $200 million emergency assistance approved by its Board of Directors on 24 June—to support rebuilding of schools, roads, and public buildings. The government estimated the total pledge of assistance at $4.0 billion (equally spilt in grants and concessional loans). Of the total pledge, about 67% is new commitment ($2.7 billion). Cumulatively, India and the Peoples’ Republic of China committed $1.4 billion and $767 million, respectively. World Bank, Japan, the US and the EU pledged $500 million, $260 million, $130 million, and $117 million, respectively.

According to the PDNA, total public sector losses and damages amount to $1.7 billion, which excludes housing. The National Planning Commission estimated that about 57% of the recovery needs ($3.8 billion), including housing, will have to be shouldered by the government. In this respect, the total pledged amount was higher than the public sector recovery needs till the medium-term. However, a much higher amount of investment may be needed in the long-term to build better and earthquake-resilient public infrastructure throughout the country.

Total aid pledged for reconstruction ($ million)

Source: Ministry of Finance; ADB staff estimates

VII. FY2016 Budget and Monetary Policy

The FY2016 budget is primarily focused on rehabilitation and reconstruction of physical and social infrastructure, housing and livelihoods after the catastrophic earthquake.

Completing of reconstruction work within the next five years is the most prominent agenda. It commits to fully operationalize the NRA soon, with a special implementation authority, effective leadership, and adequate financial resources. A total of NRs91 billion ($910 million or 3.8% of GDP) has been earmarked for reconstruction work, including $740 million (3.1% of GDP) for the National Reconstruction Fund, which will initially prioritize reconstruction of housing, public buildings, archeological structures, physical infrastructure, and enhancement of productive capacity. About $170 million is earmarked for sector ministries and agencies to carry out reconstruction works till the NRA is operational, i.e. an interim arrangement.

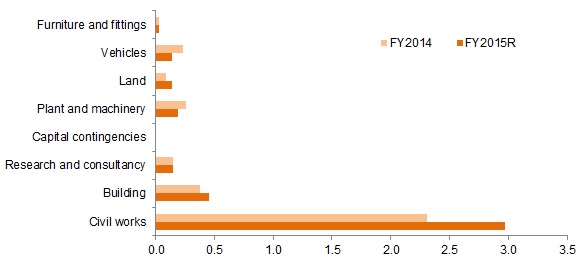
Planned reconstruction budget for FY2016 and composition of National Reconstruction Fund (NRs billion)

Source: FY2016 Budget Speech

The budget also includes NRs200,000 (about $2000) for each household that has lost its house due to the earthquake. To address the shortage of labor for reconstruction, skill training is planned for 50,000 people in the areas of masonry, plumbing, and electrical works.

Meanwhile, to assist government, Banks and Financial Institutions (BFI), and the public in their efforts toward accelerated post-earthquake recovery, Nepal Rastra Bank (the central bank) introduced a number of measures in the monetary policy for FY2016, including:

  1. Zero percent refinancing facility for BFIs willing to provide loans at 2% interest to those households affected by the earthquake, provided that such households meet the requirements set by the government. Accordingly, households within and outside Kathmandu Valley can access the subsidized loans of up to NRs2.5 million and NRs1.5 million, respectively.
  2. As announced in the FY2016 budget speech, the NRB will help assist in the establishment of an Economic Rehabilitation Fund, which will provide refinancing facility and interest subsidy to the business community affected by the earthquake.
Breakdown of reconstruction budget for FY2016
NRs billion GON Grant Loan Total Share of aid
National Reconstruction Fund 16 36 22 74 78
Recurrent expenditure 8 15 12 35 77
Program expenses 2 0 0 2 0
Capital grants to institutions & individuals 6 15 12 33 82
Capital expenditure 8 21 10 39 79
Building construction 2 10 5 17 88
Civil works 6 11 5 22 73
Natural disaster relief & reconstruction 17 0 0 17 0
Recurrent expenditure 2 0 0 2 0
Capital expenditure 15 0 0 15 0
Civil works 5 0 0 5 0
Capital contingencies 5 0 0 5 0
Capital formation 5 0 0 5 0

Source: FY2016 Red Book; Budget Speech            

VIII. Effective reconstruction and recovery

Recovery has to be faster, better and smarter given that the country lies on an active geological fault lines. Drawing from ADB’s experience in post-disaster recovery in Asia and the Pacific region, ADB President Nakao highlighted, during the reconstruction conference, five principles for effective reconstruction that Nepal could follow:

  1. Public as well as private buildings should be rebuilt to earthquake-resilient standards, fully applying the principle of “Build-Back-Better”.
  2. Inclusiveness should be at the core of reconstruction effort. Special attention should be paid to the needs of the poor, rural residents, and other vulnerable social groups, who have suffered more from the earthquakes.
  3. A robust institutional setup for reconstruction is pivotal to successfully execute reconstruction projects within the given timeframe. A strong leadership and competent human resources are vital for the success of the NRA.
  4. Continuous enhancement of the institutional capacity of executing and implementing agencies along with the adoption of sound governance and fiduciary risk management systems for the reconstruction process are also important.
  5. Effective donor coordination and strong government ownership of the entire process are also equally important for the success of the reconstruction projects.

He also emphasized that reconstruction should go hand in hand with development programs already planned, without affecting the latter.

IX. Accelerated recovery and structural transformation

The reconstruction authority’s and sector ministries’ ability to swiftly prepare and implement viable projects will underpin the scope and pace of reconstruction, and hence the recovery phase. A coherent reconstruction strategy has to be ideally aligned with the long-term economic development vision, which aims to increase per capita income to the level of a middle-income country before 2030. This is especially important because the PDNA covered earthquake-resilient reconstruction only in the affected areas, whereas this has to be implemented throughout the country. Adhering to the principle of Build-Back-Better, t rebuilding damaged houses beyond the set size, retrofitting standing buildings in Kathmandu Valley and affected districts, and nationwide resilience (such as ensuring housing and school safety across the country) need to be kept in mind while planning and initiating rehabilitation and reconstruction projects.

Overall, rehabilitation and reconstruction should primarily aim at increasing productivity-enhancing public capital investment. This is a key to ensuring structural transformation whereby high value-added and high-productivity sectors are more dominant than low value-added and low-productivity sectors in the medium term. Promoting agribusiness, industrial capacity, innovation and high-productivity services need to be at the center of such a reconstruction and structural transformation strategy. In addition to higher investment, this will require reforms on institutional, legal, regulatory, and capacity enhancement fronts.

Structural transformation

Source: Authors’ estimate

Private investment has been suppressed primarily due to the liberal product market (including imports), but an unreformed factor market (land, labor, and capital) after 1992 (the time when the first set of liberalization reforms were rolled out). This has led to stunted growth of the manufacturing sector and its declining share of GDP as imported-based activities expanded. Given this background, a higher quantum and quality[4] of capital spending is vital to boost aggregate demand, expand the growth potential of the economy, and increase per capita income. Higher productivity-enhancing public capital investment would also increase returns on private investment, resulting in higher private investment due to the ‘crowding-in’ effect. Such public investment over the medium term in physical and social infrastructure enhances productivity growth, encourages technological innovation, accelerates recovery and establishes a faster, inclusive, and sustainable growth pattern. However, in the long term, structural changes, especially in factor markets (land, labor, and capital), are required to sustain the growth pattern established through stabilization measures over the medium term.

X. Concerns over effective budget execution

One of the biggest unknowns following the decision to establish the NRA is its ability to fully execute the planned reconstruction budget in well-planned productivity-enhancing projects. This concern arises from the persistent budget execution shortfalls even under normal circumstances, which has further weakened in the last decade. As such, actual capital spending averaged about 72% in the last decade and about 60% is bunched in the last quarter. Furthermore, the actual capital spending (about 3% to 4 % of GDP) is far less than the required spending (of 8-10% of GDP) to close the infrastructure gap..

Planned and actual capital spending (% of GDP)

Note: Changed reporting system to Government Finance Statistics (GFS) 2001 in FY2012. In FY2011, actual reporting was done based on GFS 2001, but budget allocation was done based on earlier GFS.

Source: Ministry of Finance; NRM staff estimates

Capital spending is marred mainly by:

  1. Bureaucratic hassles: project approval delays, and weak intra and inter-ministry coordination,
  2. Structural weaknesses: limited appraisal, planning, and implementation capacity of line ministries (including the lack of medium-term expenditure framework), lack of strong pipeline of projects ready for implementation, cumbersome laws and regulations (procurement and procedural clearances), and allocative inefficiency,
  3. Low project readiness: lack of feasibility studies and detail designs in advance, lack of well-planned procurement plans, and delays in land acquisition,
  4. Weak project management: high staff turnover, lack of staff capacity, lengthy procurement process, weak contractor capacity, and weak contract management
  5. High fiduciary risks in project implementation, particularly in rural areas when programs are implemented through local government having limited human resources and capacity,
  6. Political instability and interference at operational level

The budget for FY2016 partially addresses this concern by giving the line ministries administering large projects the authority to spend the planned budget without getting prior approval from the NPC and the MOF. Similarly, multi-year contracts are allowed for some projects and the government has committed to restrict transfer key project staff subject to satisfactory progress in implementation. Deployment of managers, accountants, and technical staff is envisaged in village development committees starting with earthquake affected areas. However, other issues outlined above impeding regular capital spending remain unchanged and it is likely that $170 million allocated to various line ministries for reconstruction work may remain underspent at the end of FY2015.

With regard to spending by the NRA, the ordinance, which needs to be transformed into an Act without delay, governing its establishment gives it sweeping powers to do away with most of the hassles impeding accelerated capital spending. The authority is chaired by the Prime Minister and its CEO will independently handle the operations. The CEO, whose performance will be critical to accelerated reconstruction within the given timeframe, was still not appointed two months after the ordinance for its establishment was introduced. This already delayed the pace of implementation, especially concerning hiring of human resources, preparing a quick pipeline of projects, an associated action plan for investment, and its overall synchronization with the long-term development vision being envisaged by the NPC. The faster the NRA comes into operation, the faster will be the capital spending and ultimately completion of the reconstruction programs.

The NRA will have a critical role in managing the following crucial issues for accelerated reconstruction and recovery:

  • Hiring competent human resources that can bring in new and smarter ideas and foster innovation (including reassigning competent civil servants from across government departments)
  • Preparing a credible time-bound action plan for investment in reconstruction projects, including a sizable pipeline of potential projects
  • Managing political interference in normal operations and preparation of reconstruction projects and ensuring an inclusive development process
  • Ensuring line ministries’ full ownership of projects designed, approved and procured by the NRA
  • Coordinating with development partners to ensure that the committed funds for reconstruction are realized within the given timeframe
  • Engaging meaningfully youth, local communities, think tanks, specialized institutes, and civil society in reconstruction planning, design, implementation, monitoring, and evaluation
  • Ensuring ‘crowding-in’ of private investment for reconstruction on public-private partnership (PPP) basis
  • Outsourcing of managerial as well as non-managerial work (time and output-bound contractual arrangement for design, supervision, and management of reconstruction projects).

XI. Conclusion

The earthquake caused tremendous loss of lives and properties. It lowered economic growth rate, pushed about a million people below the poverty line, slowed progress on achieving some of the MDGs, and sapped investors and consumer confidence. The cumulative pledges during the international reconstruction conference exceeded the expected public sector needs for reconstruction. Now, the NRA and line ministries’ ability to swiftly prepare and implement viable projects will underpin the scope and pace of reconstruction and ultimately a better, faster and smarter recovery. The authority needs to be operationalized without delay and it has to chart out a coherent five-year reconstruction strategy by aligning it with the long-term economic development vision.

Accelerated reconstruction would require hiring of competent human resources, preparing a time-bound investment action plan, a strong pipeline of viable projects, outsourcing of design, monitoring and evaluation, political buy-in of proposed actions, and engaging youth, specialized institutions, and civil society at various stages of the project cycle. This would then ‘crowd in’ private investment as well, leading to a higher, sustainable, and inclusive economic growth. Overall, rehabilitation and reconstruction should primarily aim at increasing productivity-enhancing public capital investment, which is a key to ensuring structural transformation whereby high value-added and high-productivity sectors are more dominant than low value-added and low-productivity sectors in the medium term.


[1] Gross output is the total value of all goods and services produced during the accountancy period (at basic prices). Intermediate consumption is the total value of goods and services consumed as inputs by production processes (at purchasers’ prices). Gross value added is the difference between gross output and intermediate consumption. Finally, GDP is equal to gross value added plus taxes minus subsidies.

[2] The Ministry of Labor and Employment directed overseas recruitment agencies to facilitate migration without financially burdening the migrant workers. This essentially means cost-free migration for workers seeking employment in Saudi Arabia, Qatar, Kuwait, the United Arab Emirates, Bahrain, Oman and Malaysia.

[3] IMF. 2015. Nepal: Request for Disbursement Under the Rapid Credit Facility. IMF Country Report No.15/224. Washington, DC. See: http://www.imf.org/external/pubs/ft/scr/2015/cr15224.pdf

[4] Low quality of capital spending escalates future recurrent costs associated with the project (such as operation and maintenance costs, staff required to monitor the project, etc)