Monday, December 23, 2013

Nepal's and Africa's structural transformation

Africa's ongoing structural transformation is strikingly similar to Nepal's slow structural transformation. It is characterized by the shift of workers and economic activities from agriculture sector to low productive, low-value added services sector activities, resulting in a slowdown in transformation. Eventually, there aren't enough jobs for the youth and the economy is stuck in a low growth trap.

Most of the GDP growth is coming from non-tradable sectors such as construction, retail and wholesale trade and real estate and housing. The demand for these services sector activities are in turn driven by public expenditure, and remittances. Tradable sectors such as manufacturing and high-value agriculture activities are not prominent. Worse, more and more workers are shifting to informal activities in services sector until they find jobs overseas. Addressing this will be one of the major economic challenges for the Constituent Assembly II, if the country wants to realize its goal of graduating from LDC status by 2022

Dani Rodrik writes about Africa's structural transformation:

As researchers at the African Center for Economic Transformation in Accra, Ghana, put it, the continent is “growing rapidly, transforming slowly.”
In principle, the region’s potential for labor-intensive industrialization is great. A Chinese shoe manufacturer, for example, pays its Ethiopian workers one-tenth what it pays its workers back home. It can raise Ethiopian workers’ productivity to half or more of Chinese levels through in-house training. The savings in labor costs more than offset other incremental costs of doing business in an African environment, such as poor infrastructure and bureaucratic red tape.
But the aggregate numbers tell a worrying story. Fewer than 10% of African workers find jobs in manufacturing, and among those only a tiny fraction – as low as one-tenth – are employed in modern, formal firms with adequate technology. Distressingly, there has been very little improvement in this regard, despite high growth rates. In fact, Sub-Saharan Africa is less industrialized today than it was in the 1980’s. Private investment in modern industries, especially non-resource tradables, has not increased, and remains too low to sustain structural transformation.
As in all developing countries, farmers in Africa are flocking to the cities. And yet, as a recent study from the Groningen Growth and Development Center shows, rural migrants do not end up in modern manufacturing industries, as they did in East Asia, but in services such as retail trade and distribution. Though such services have higher productivity than much of agriculture, they are not technologically dynamic in Africa and have been falling behind the world frontier.
[...]The African economic landscape’s dominant feature – an informal sector comprising microenterprises, household production, and unofficial activities – is absorbing the growing urban labor force and acting as a social safety net. But the evidence suggests that it cannot provide the missing productive dynamism. Studies show that very few microenterprises grow beyond informality, just as the bulk of successful established firms do not start out as small, informal enterprises.
[...]Two decades of economic expansion in Sub-Saharan Africa have raised a young population’s expectations of good jobs without greatly expanding the capacity to deliver them. These are the conditions that make social protest and political instability likely. Economic planning based on simple extrapolations of recent growth will exacerbate the discrepancy. Instead, African political leaders may have to manage expectations downward, while working to increase the rate of structural transformation and social inclusion.
Wednesday, December 18, 2013

Trade liberalization and informal sector

Abstract of a working paper by Arias et al (2013), who argue that the entry costs to informal employment is significantly lower and that trade liberalization leads to a rise in the number of informal sector workers as previously idle workers enter the labor market:

Informal employment is ubiquitous in developing countries, but few studies have estimated workers' switching costs between informal and formal employment. This paper builds on the empirical literature grounded in discrete choice models to estimate these costs. The results suggest that inter-industry labor mobility costs are large, but entry costs into informal employment are significantly lower than the costs of entry in formal employment. Simulations of labor-market adjustments caused by a trade-related fall in manufacturing goods prices indicate that the share of informally employed workers rises after liberalization, but this is due to entry into the labor market by previously idle labor.


Saturday, December 7, 2013

The Bali Package: Benefits worth $400 billion to $1 trillion over the years

At the Ninth Session of the Ministerial Conference of the WTO in Bali, the 159 member countries agreed to a deal (the Bali Package) whose benefits to the world economy are estimated to be between $400 billion and $1 trillion over the years, mainly through reduction in costs of trade by between 10% and 15%, increasing trade flows and revenue collection, creating a stable business environment and attracting foreign investment. The deal is expected to be adopted by the General Council by 31 July 2014.

It is described as the first major WTO agreement since 1995. The main highlight of the package is the trade facilitation part aimed at cutting red tape and speeding up port clearances. The other features of the package relate to food security and cotton production in developing countries, and a political commitment to reduce export subsidies in agriculture.
Some of the major highlights below:

Trade facilitation:
  • A multilateral, legally binding deal to simplify customs procedures by reducing costs and improving their speed and efficiency.
  • Specifically, it will speed up customs procedures; make trade easier, faster and cheaper; provide clarity, efficiency and transparency; reduce bureaucracy and corruption; and use technological advances.
  • Includes provisions on goods in transit, which is of interest to landlocked countries like Nepal.
  • Assistance for developing and LDCs to update their infrastructure, train customs officials, or for any other cost associated with implementing the agreement.
Agriculture and cotton:
  • An interim, until a permanent one is agreed upon, solution related to the shielding of public stocking programs for food security. [Solution: “Members would temporarily refrain from lodging a legal complaint (“due restraint”, sometimes also called a “peace clause”) if a developing country exceeded its Amber Box limits as a result of stockholding for food security. Work on finding a longer term solution would continue after the ministerial conference. Countries using these policies would provide up-to-date data and other information on what was involved, so that other countries could see what was happening.”] It commits countries using the new flexibility to ensure that their food stockholding scheme does not “adversely affect the food security of other Members.”
  • Tariff quota administration measures include a combination of consultation and provision of information when quotas are under-filled.
  • Export subsidies and other measures with similar effect to be low.
  • Improving market access for cotton production from LDCs along with development assistance for boosting production.
Development issues:
  • No changes in other provisions (from Geneva versions) such as duty-free, quota-free access for LDCs, simplified preferential rules of origin for LDCs, and services waiver for LDCs, among others.
  • Monitoring of special and differential treatment.
  • Preferential rules of origin will make it easier for LDCs to export their goods.

Full Bali Ministerial Declaration here. Not all Doha Development Agenda issues are sorted out. These will be taken up in further trade negotiations. Earlier rounds of negotiation and Nepal’s interest here.

Friday, November 29, 2013

Reimagining Nepal!

The following paragraphs are pertinent to the Nepalese context. All are related to a recent book titled "Reimagining India: Unlocking the Potential of Asia’s Next Superpower".

Sheridan Jobbins (Extracted from a review of the book):

The complexity of India is picked up by Coca Cola’s Muhtar Kent, the son of a diplomat who spent his formative years in India. “If you come to India with some grand, predetermined strategy or master plan, prepare to be distracted, deterred, and even demoralized.” If that sounds daunting, he proceeds with optimism by detailing a plan for success: focus on training and talent recruitment, and source products from within India to deepen ties to the market. Among his stories is that of the 5by20 initiative, “which seeks to bring additional business training, finance opportunities, and mentoring to five million women entrepreneurs across our global value chain by 2020. Indian women make up a significant focus of this program.”

Fareed Zakari:

I remain optimistic. We are watching the birth of a new sense of nationhood in India, drawn from the aspiring middle classes in its cities and towns, who are linked together by commerce and technology. They have common aspirations and ambitions, a common Indian dream—rising standards of living, good government, and a celebration of India’s diversity. That might not be as romantic a basis for nationalism as in days of old, but it is a powerful and durable base for a modern country that seeks to make its mark on the world.

Anand Mahindra:

All Indian states will have to improve their infrastructure and climate for doing business if they want to contend for major projects. In this way, investment will drive innovation and changes to the system much more efficiently than any edict from Delhi could. Tata Motors’ decision to shift its Nano project from West Bengal to Gujarat illustrates the point.

Yasheng Huang:

You have to include the workers, the women, villagers, and the rural Indians into the growth machine. We’re talking about simple manufacturing. We’re talking about simple service-sector jobs that require basic reading, a little bit of math, functional capabilities. And labor regulations in India are killing those potentials. They don’t kill the IT, they don’t kill the high tech, but they do kill the blue-collar manufacturing jobs, which India needs the most.
The other area that would require more government intervention is in the social sector—health and education. If the government doesn’t provide health and education, nobody can come close to matching the government. And this is where you actually want more government intervention. You want more tax money to go in those sectors. And the Indian government is not able to collect enough taxes to spend on health and education; it is also constrained administratively and politically in terms of scaling up education.
If India doesn’t fix the problem of education—primary-education, first-tier education—they are going to undermine their success in the high-tech sector. The reason is very simple. The tertiary education requires a long pipeline of college-ready students. If you don’t fix your primary education, if you don’t fix your high school, primary school, you’re going to have a very narrow pipeline.

Sunday, November 24, 2013

NEPAL: Major economic issues for Constituent Assembly II

The Constituent Assembly (CA) II election is almost over with the final tallying of 240 winners in the directly elected (first past the post) part. More will be decided based on proportional representation votes and nomination of 26 additional members by the political parties, filling in the CA II with 601 members. Hopefully, the CA II members will be able to iron out differences and deliver the Nepalese people an inclusive constitution.

Notwithstanding the political developments in the days ahead, below are some of the major economic challenges the CA II will have to deal with. At the outset, let me state that any economic and development narrative without migration and remittances, which are having profound impact at micro, macro and institutional levels, is incomplete. 

The figure below shows the sectoral contribution to GDP growth and GDP growth (basic prices).
   
Management of migration and remittances: Coherent policies to manage migration and remittances are missing despite these being the lifelines to the economy, which is struggling to grow beyond 5%. Nearly 1250 workers legally left the country each day for work overseas in FY2013. Both push and pull factors are at work here. Despite the high financial and human costs of migration for unskilled and low skilled works, there is little leverage (apart from fixing minimum wage for Nepalese workers in certain countries) Nepal has in terms of addressing these issues beyond its borders. The CA II members will have to come up with policies and strategies to better manage migration of Nepalese workers in such a way that it results in a win-win situation.

These may include: (i) wider publicity about the pros and cons of overseas migration for work; (ii) clarity on the total wage and income differences between overseas work and comparable jobs domestically; (iii) skills training to migrants in view of the jobs or sectors they will be working overseas (this will give them better clarity of the nature of work and will also help them fetch better salaries); and (iv) better facilitation in documentation (to prevent them from scams and agents who take a ‘cut’ from their income) and at the exit point (especially at the Tribhuvan International Airport). The overseas migrant workers (some of them cannot even fill out the necessary forms) need to be respected and provided appropriate assistance where necessary.
 
Regarding remittance inflows, which amounted to an estimated 25.5% of GDP in FY2013, the government will have to urgently explore how to better channel remittances to productive usages as almost 80% of it is used for daily consumption by households. Nepal cannot ride against the tide and will have to learn to live with high and persistent remittance inflows. The only option now is to leverage remittances to productive usages such as: (i) investment in infrastructure (including energy); (ii) high value agriculture production; (iii) commercial agricultural activities; (iv) industrial sector investment; and (v) high value service sector activities, among others. India and Israel have successfully raised billions of dollars by selling bonds targeted at expats and workers overseas. Similarly, the Philippines and other countries are doing good work in both raising awareness among migrants and channeling remittances to productive usages. 

Some of the policy options could be: (i) an attractive foreign employment bond; (ii) infrastructure bonds with guaranteed competitive yield; (iii) macroeconomic stability to reduce the cost of doing business and the promotion of SMEs; (iv) financial literacy; and (v) innovative measures such as providing loans without collateral to both migrants and remittance-receiving migrant households (but also without much downside risks to the creditor). An example from the Philippines: The central bank of the Philippines focused on increasing remittance inflows through formal channels by allowing Filipino banks to open branches in major employment destinations for Filipinos, reviewing fee structure for transaction, and promoting financial literacy at home and abroad among Filipino migrants. The financial literacy initiatives focused on the available investment opportunities for both remitting and recipient households, and the detection of financial scams.

Fiscal management (timely and full budget): The lack of political consensus in the CA I severely affected the budget process and negatively affected public expenditures, particularly capital expenditure (a mere 3.1% of GDP in FY2013). Higher quantum and quality of capital expenditure is crucial for inclusive and sustainable economic growth, and to ‘crowd-in’ private investments. The fiscal budget needs to be introduced well in advance and in whole. Piecemeal budgets equal to a percentage of previous year’s actual expenditure will hamper not only fiscal management, but also the potential for inclusive growth. 

The figure below shows total, recurrent and capital expenditures as a share of GDP.
   
On the same note, Nepal’s recurrent expenditure is rising so fast that the impressive tax revenue mobilization (15.3% of GDP in FY2013) is nearly equal to recurrent expenditures (15.2% of GDP in FY2013). Nepal needs to rationalize expenditures as well so that unproductive and wasteful expenditure items and subsidies are properly addressed. Some of the measures may  include: (i) timely and full budget; (ii) higher quantum of capital expenditure allocation and quality spending as well; (iii) rationalization of recurrent expenditure by taking out unproductive expenditure items form the Red Book; (iv) focused expenditure plan to address the binding constraints to inclusive growth; (v) rationalization of subsidies, particularly fuel subsidies; (vi) trimming the number of public employees, especially redundant staff hired without a specific work plan and due to pressure from political leaders; and (vii) reforming, including privatizing, the inefficient state-owned enterprises. Meantime, the tax net needs to be broadened instead of increasing cumulative tax rate each year. The ideal tax rate and system should be a function of the ability of citizens to afford tax payments without much difficulties, one that encourages additional enrollment in tax system, and one that entices domestic and foreign investments.

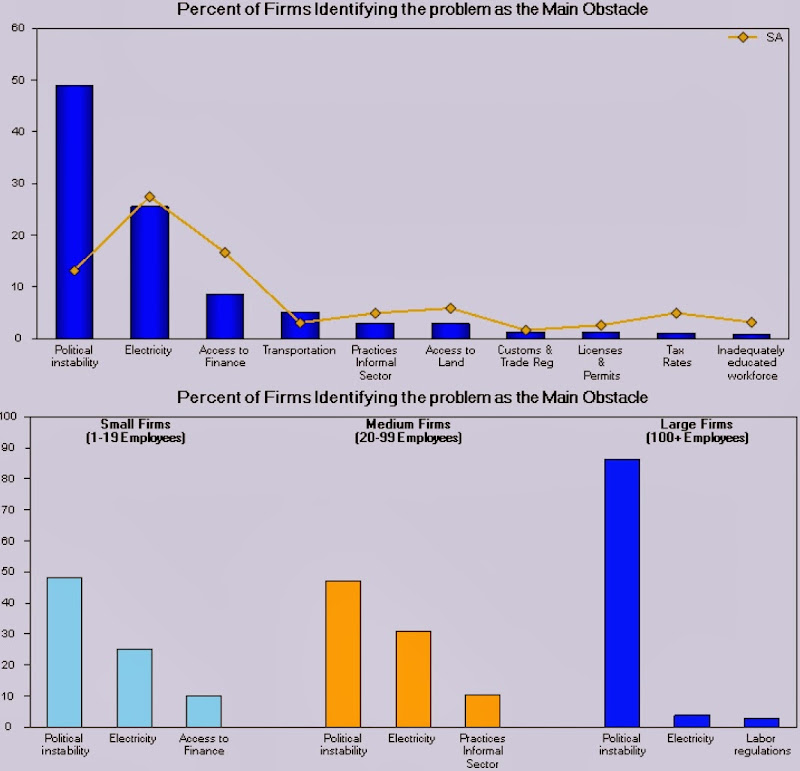
Load-shedding reduction: Load-shedding has been one of the most significant drags on economic activities in Nepal. The lack of electricity is identified as the second most problematic factor for doing business in Nepal, and 75.6% of firms consider it as a major constraint. About 50.5% of firms own or share a generator and it supplies, on average, 34% of electricity required by firms. The electrical outages cost firms, on average, 17% of annual sales. The adequate supply of electricity will be a major stimulant to economic activities and will potentially be a significant factor that helps push GDP growth beyond 5%. However, implementing reforms on this sector is also the hardest due to the strong lobby of interest groups and some sections in bureaucracy and political spheres.
Some of the measures, which may be politically unpalatable, include: (i) restructuring the Nepal Electricity Authority (NEA) so that it does not remain a dysfunctional behemoth with monopoly and monopsony powers; (ii) passing major reforms related to PPA; (iii) enticing private sector to develop power plants of all ranges (small, medium and large) by offering appropriate incentives, including sovereign risk guarantee and purchase of electricity in dollar terms, if required; (iv) promoting alternative and off-grid energy subject to budget constraints; (v) promoting cross border trade of electricity along with a PPA with India; and (vi) seeking a constructive role (as opposed to obstructive role) of employees and employees’ unions of NEA. If the NEA cannot be restructured, then its generation, distribution, and transmission functions could at least be unbundled to bring about transparency in operations and implement efficiency-enhancing reforms.  

Meaningful structural transformation: An unusual structural transformation is taking place right now, resulting in a growth trap of below 5%. Deindustralization process is ongoing well before the industrial sector's strengthening and the absorption of labor from agriculture sector. Labor moving out of agriculture is either going abroad for jobs or temporarily engaged in low value added, low productive service sector activities. The shift of workers and economic activities to less productive services sector activities instead of the industrial sector being a focal point for their absorption is not normal and doesn't contribute much to creating a strong foundation for the economy to take-off on a high and inclusive growth path. The low value added activities such as real estate and housing; wholesale and retail trade; hotels and restaurants; transport and storage, among others constitute almost 34% of GDP, which is equal to that of the agriculture sector’s share of GDP. The manufacturing sector’s share is only about 6.2% of GDP. In fact, the wholesale and retail trade, which is mostly based on imported goods, is larger than mining and quarrying; manufacturing; electricity, gas and water; and construction combined (i.e. the industry sector). Nepal’s industrial sector has been consistently underperforming; and for its income level, though the services sector’s contribution to GDP is relatively high, its impact on growth and employment generation is low. Furthermore, the increase in per capita income as countries get richer is initially associated with the expansion of industrial sector and then after a certain income level, its contribution starts to moderate. However, even with one of the lowest per capita incomes in Asia and the Pacific, Nepal’s industrial sector’s contribution seems to have tanked and consistently declining.
 
The intersection between the decline of agriculture sector and the increase of services sector occurred at around US$219 per capita GDP. It was circa 1998, the time when Nepal benefited favorably for a short time period from the Nepal-India trade treaty of 1996 (no value addition requirement in manufacturing goods exported to India). However, this was also the time when the Maoist insurgency started to heat up, forcing large number of people to migrate out of rural areas. Meantime, the inclement investment climate led to closure of many firms in the industrial sector, resulting in loss of jobs, high value production and productive activities. Consequently, those who migrated to urban areas and new entrants to the labor force either opted to seek employment overseas or engage in low value added, low paying services sector activities domestically. The high inflow of remittances has further fueled this process.

A meaningful structural transformation to sustain a high and sustainable growth would require a strong industrial sector and high value added agriculture and services sector activities, with an employment-centric strategy to absorb the surplus labor. To promote higher productivity, high value-added production and high income generation, the agriculture sector requires adequate and appropriate commercialization, provision of necessary infrastructure and technology to link with the industrial sector, and promotion of agribusiness activities such as agro-processing, storage, and warehousing, among others. Similarly, for high productivity and value added services sector activities, there needs to be strong backward and forward linkages with the industrial sector along with the narrowing of skills gap required in the market, increase in R&D investment to promote innovation, and investment in education and health sectors to boost the capacity of the economy to sustain progress and prosperity. This would partly position and help sustain the industrial sector as an engine of inclusive growth.

Export competitiveness: Had it not been for remittances, Nepal would not have been able to afford such a high level of imports (over 25% of GDP against exports of about 5% of GDP). Exports are going down consistently. Sophistication of Nepal’s export basket is very low. The export items are still low-valued goods with high price elasticity of import demand. Nepal is losing competitiveness in its major export, i.e. garments. The main domestic factors include: (i) lack of adequate supply of infrastructure, including energy; (ii) political instability/strikes; (iii) labor disputes; (iv) lack of innovation by private sector; and (v)policy implementation paralysis.
 
Apart from addressing the supply-side constraints, the government needs to devise smart strategies to foster R&D investment, innovation, production of high-value added goods and services based on comparative advantage and endowment, and promote Nepalese items in the international market (this would also require active involvement of Nepalese embassies and consulates aboard). Other major initiatives on this regard could be to establish and operationalize Special Economic Zones (SEZs) and to implement the cash incentives scheme with goals to not only boost export revenue in dollars, but also to promote firms with high potential for export competitiveness and productive employment. Nepal also needs to take advantage of bilateral (especially with India) and regional treaties (SAFTA, BIMSTEC) and preferential treatment accorded to LDCs by the developed countries. Increasing capacity utilization of industries (on average, at just 60% right now) by lowering load-shedding and resolving labor disputes could be the starting points.

Labor disputes: Repeated labor disputes have been one of the most thorniest issues in Nepalese economy. Many multinationals closed down manufacturing plants precisely after the intensification of labor disputes. Nepal has too many labor unions, which largely act on behalf of the political parties. The bickering over wages and repeated revision of wages have positioned Nepal as the country with the highest minimum wage in South Asia. However, productivity hasn’t increased in proportion to the rise in wages. Note that, higher wages are not bad in itself if they are matched by a rise in productivity (so that firms remain competitive). Nepal’s labor unions needs to be guided more by the welfare of the workers, and less by the whims of the political leaders. Furthermore, they also need to be aware that with high productivity and competitiveness comes higher revenue, which would enable employers to raise wages and offer bonuses. It should be a win-win-win relation (government-industries-workers).
 
Taming high inflation:  With the government’s failure to clamp down on inflation, which is hovering above 8% since FY2009, people have built up expectations that prices will not come down in the near future (or say embedded expectations at a higher base). Inflation above 8% is becoming a ‘new inflationary normal’. For comparison, inflation was as low as 2.4% in FY2001. High inflation erodes people’s purchasing power, renders production uncompetitive, and discourages investment. It also forces government and firms to revise up wages, irrespective of the gains in revenue and productivity. In real terms, it makes people poorer in the absence of a proportional rise in income.
    
Traditionally, high inflation has its roots on too much money chasing too few goods, i.e. when the demand for goods (backed by too much money in hands of people) outstrips supply of goods. The very fact that Nepal's currency is pegged to Indian rupee and over 60% of trade occurs with India means that inflation in India will naturally affect prices here. Research shows that about one-third of the price variability in Nepal is determined by prices in India. On the domestic side, persistent structural bottlenecks and supply-side constraints have contributed to keeping prices at a higher level. Notable supply-side constraints include the lack of adequate supply of electricity, transport bottlenecks, lack of raw materials leading to high import content of manufactured goods (further affected by depreciation of Nepalese rupee), inadequate supply of key inputs to boost productivity, administered fuel prices, wage pressures, distortions by middlemen  and strikes, among others.

Good governance: Governance is a never-ending issue. Transparency International repeatedly ranks Nepal as one of the most corrupt economies. According to the Enterprise Survey 2013, about 51.3% of firms expected to give gifts to secure government contract. Also, there is hardly any crosscheck on the quality of assets created with government (alternatively, tax payers') money. About 44.7% of manufacturing firms identified corruption as a major constraint in 2013. Major public sector reforms along with strengthening of the anti-corruption body are needed. Good governance and transparency of financial transactions have to be exemplified right from the political parties’ level to the lowest rungs of government bureaucracy and the private sector.


Of course, all of the economic issues cannot and will not be addressed by the CA II. However, it could play a vital role in preparing the ground for difficult policy and institutional reforms while exploiting the 'low hanging fruits'.

Friday, November 22, 2013

Changing understanding of poverty, progress and revised goals

Kaushik Basu explains:


Early in 2013, the World Bank Group adopted two overarching goals to guide its work and in April 2013 these were endorsed by the Group’s Board of Governors. The goals, stated briefly, consist of the following: (i) to end extreme, chronic poverty in the world by 2030 and (ii) to promote shared prosperity in every society. To give these goals the concrete shape essential to drive a large organization and gauge success and failure, they had to have measurable forms. 
It was decided to define extreme poverty as living on less than $1.25 (ppp adjusted) per person per day. Since the aim is to end chronic poverty and since frictional poverty—stemming from unexpected economic fluctuations in poor countries, political conflict and war—cannot as yet be brought to an end, the first goal is formalized as a target of bringing the number of people living below this ‘poverty line’ to less than 3% of the world’s population.
The second goal, with its oblique reference to growth and distribution, is defined, formally, as the aim of fostering the per capita income growth of the poorest 40% of people in each country.
Since these targets were set not as goal posts to be touched and retreated from, it is implicit that the goals must be pursued in ways that are environmentally, socially and economically sustainable over time. In other words, achieving these goals through a blend of higher economic growth and improved social programs should not create a liability for future generations—through excessive fiscal burden, social strife or environmental damage. In brief, prosperity should be shared not just across space, but also across generations. This sustainability target is not as easy as it may seem at first sight. It has practical and political challenges galore, as documented, for instance, in Stern (2007). In addition, there are some intricate conceptual challenges.

Wednesday, November 13, 2013

High (financial) cost of migration

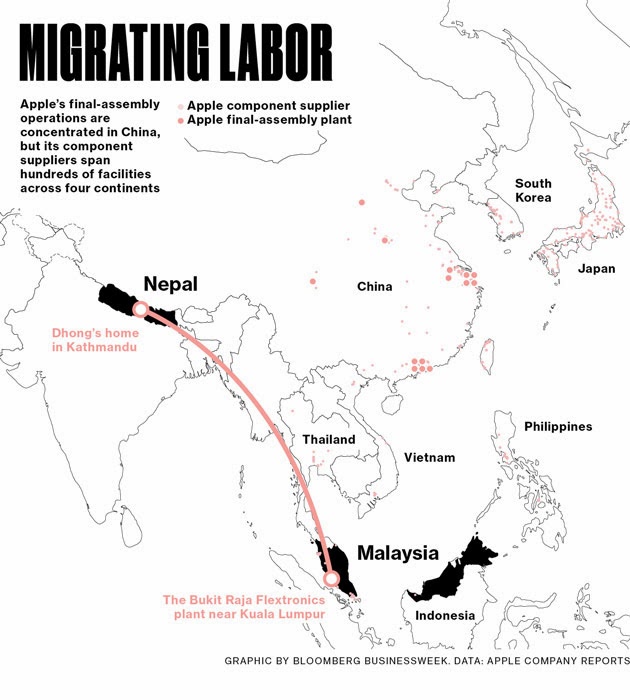
Here is a revealing piece on the global supply chains and how Nepalese migrant workers are related to it.


The piece also tracks the cost of migration to Malaysia. It comes out to be over $1000 plus interest.

Excerpts from the article:

At some point, he paid $250 to a recruiter who promised to line him up with a good foreign job. That recruiter then connected him to a broker in Kathmandu, one of more than 750 registered with the government. Dhong left his passport with the overseas broker—and waited. On Oct. 14, 2012, he got the call. He was told to get to Kathmandu’s Tribhuvan International Airport for a flight in three hours and to bring the equivalent of $500, or about six months of his dairy wages. There was no way Dhong could come up with that much cash, pack, and leave so quickly, so the broker told Dhong to bring as much money as he could to the office, then head to the airport at the same time the next day. Dhong and his wife borrowed about $350 from a local lender. He gave it to the broker, saying it was all they had. The broker took the cash and told Dhong to meet yet another agent, the third link in Dhong’s own personal supply chain, at the airport.
Dhong grabbed a black-and-tan backpack holding his shaving kit, a single change of clothes, two Bibles (one in Nepalese, one in English), and three family photos. He said goodbye to his crying wife and daughter, then jumped onto a microbus on a loud and dusty Kathmandu road. As promised, the third agent was at the airport, holding Dhong’s passport. He demanded money, but Dhong had nothing left to give. So the broker told Dhong to sign a debenture agreement promising to pay $400 more. If Dhong didn’t sign and if he didn’t quickly pay, he would lose the job. He had yet to start work, and already he was $1,000 in debt.
Dhong signed and got his passport and a sheaf of documents. He says all the brokers involved told him never to mention the fees, because, “If any worker reveals it to anyone, he will be sent back to Nepal immediately, and he will be charged and punished.” Later that afternoon, Dhong climbed aboard a plane for the first time in his life. There were 41 others headed for Flextronics on the same flight. When the recruits landed in Kuala Lumpur on Oct. 15, a representative from Flextronics met them at the airport. He took their passports and put them on a bus that took them south of the city, then past a security gate to two high-rise towers the company rented as a hostel for the men.
By the end of October, the drive to produce cameras was in full swing. Dhong and the other men on the day shift rose around 5 a.m. to get ready and line up for buses that drove them to the factory for a 7 a.m. start—the trip could take more than an hour in the crush of traffic. When he arrived at the plant each morning, Dhong slipped into a white clean-room suit covering his body head to foot, including a tightly cinched hood. A cotton mask hid most of his face. Except for breaks, Dhong and the others stood throughout their 12-hour shifts beneath white drop-tile ceilings and fluorescent lights. Their lines were named after American states: New Mexico and Rhode Island. About 3,000 women from Vietnam and Indonesia also worked in the plant, according to the recruiting agents in Nepal, but the Nepalese workers say they had little contact with them. Contracts for Dhong and the other Nepalese men set their base salaries for 12-hour shifts at about $178 per month. It was the minimum monthly salary mandated by the government of Nepal for its citizens living in Malaysia.

More on remittances in Nepal here and here.

Monday, November 11, 2013

Structural Change in Vietnam

Brian McCaig and Nina Pavcnik explore the structural change in Vietnam and argue that "changes in trade policy, expansion of employment in foreign owned firms, and the declining role of state owned enterprises robustly contributed toward the changing structure of employment within manufacturing."

Abstract of the paper:

We examine the role of structural change in the economic development of Vietnam from 1990 to 2008. Structural change accounted for a third of the growth in aggregate labor productivity during this period, which averaged 5.1 percent per annum. We discuss the role of reforms in agriculture, enterprises, and international integration in this process. In addition to the drastic move of employment away from agriculture toward services and manufacturing, we also document the movement of workers away from household businesses toward firms in the enterprise sector, and the reallocation of workers from state owned firms toward private domestic and foreign owned firms. Manufacturing experienced particularly rapid growth in labor productivity and a large expansion of employment, as it grew from 8 to 14 percent of the workforce. Changes in trade policy, expansion of employment in foreign owned firms, and the declining role of state owned enterprises robustly contributed toward the changing structure of employment within manufacturing.

Monday, November 4, 2013

Remittances in Nepal: Can a Good Thing Eventually Become Bad?


Can a good thing eventually become bad and is there such a point when it becomes too much? Thinking about Nepal’s development, remittances appear to be precisely such an ambiguous driver. Strikingly, despite the growing importance of remittances worldwide and its increasingly high level recognition, we are missing a consistent narrative of growth and development for highly remittance dependent countries (HRDCs – a new acronym, for once, may be needed) like Nepal.

While remittances have an unambiguous direct impact on household welfare, the evidence on how they affect macroeconomic variables is mixed. Moreover, their contribution to national well-being is often under-acknowledged in those very countries they support and mixed with a sense of collective shame and fear of dependence. Here, we deliberately leave aside the thorny issue of migrant rights, recently highlighted by a feature story in the Guardian (Qatar’s World Cup ‘Slaves’), and focus on the economic impact of remittance inflows.

Nepal is an interesting case study. It is part of a small league of countries that receive a significant proportion of their income via private transfers (equivalent to 25% of GDP) and the world leader among the ones with over 10 million people.

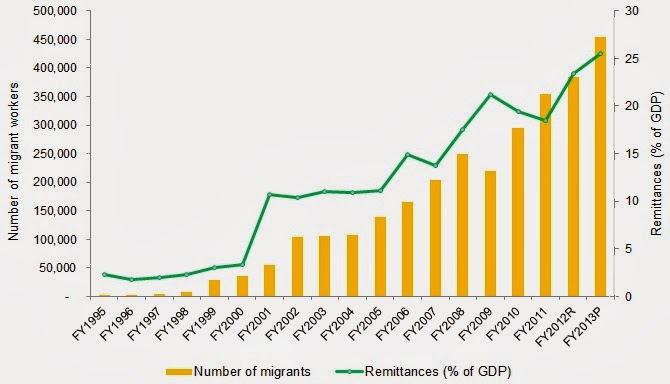
A bit of history. The migration of Nepalese workers has been taking place for centuries, particularly to India, with which Nepal shares deep cultural and historical ties. In the 19th century, a very specifically skilled subset of Nepalese – the Gurkhas – earned their country fame in the ranks of the British and Indian armies. However, a massive shift happened much later, starting in 2000, driven by both push (the Maoist insurgency in Nepal) and pull (economic boom in the Middle East and East Asia MICs) factors. In 1996, 6 workers left legally each day. By 2013 that number was multiplied by a factor of 200. Remittances followed suit rising from just 1% of GDP in 1996 to 25.5% today.

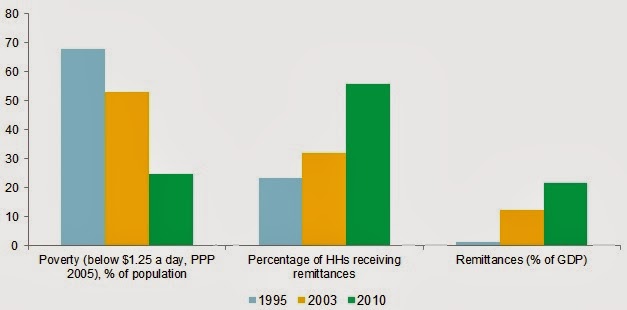
While the contribution of remittances to poverty reduction is well  documented (and striking in the case of Nepal - Figure 1), their macroeconomic impact remains under-conceptualized as well as the ways in which they could affect the long-term growth path of recipient economies.

Figure 1: Remittances and poverty

In Nepal the remittance boom has coincided with a sharp deterioration of the trade balance (with exports tanking as imports exploded), a significant shift in the composition of value added (with services taking up the space left by agriculture and a decline of industry), and high inflation. Structural transformation, at least of the type that made East Asian economies achieve massive development progress, is not happening and Nepal appears stuck in a low equilibrium growth trap (Figure2).

Figure 2: Are "labor exports" displacing tradable goods?


What do those deep structural shifts mean for developing countries like Nepal that are still struggling to come up with a consistent growth and development strategy for the future? Leaning against the tide of high and persistent inflows would be futile but simply learning to live with remittances and over-appreciated currencies is a lose proposition.  

To date, the prescriptions of the development community have been mostly adapted from the Dutch disease analogy, but these appear ill-fitting for HRDCs:

  • Fiscal contraction to avoid overheating may work in other countries facing short-lived shocks but would not help Nepal, which faces huge public infrastructure and social needs.
  • Sterilization of inflows has allowed China to maintain a competitive exchange rate; for Nepal it could be unsustainably costly given the magnitude and persistence of inflows. Likewise devaluation could spur unsustainable long term inflation.
  • Tax policies focusing more on consumption and less on income/tradables could hurt the poor.

More sensible responses emphasize structural transformation to make up for lost competitiveness, but they still appear half-baked: 

  • Labor market flexibility is particularly challenging because large outmigration may contribute to making domestic labor more rigid (low supply, high reservation wage). Is it a coincidence that Nepal has one of the highest average wage rates in the SAR region?
  • Trade liberalization may incentivize exports but could just as well annihilate import competing industries, exacerbate the negative spillovers to tradables production and increase consumption of remittance-backed imports. How else to interpret Nepal’s huge trade deficit?
  • Investment incentives may work when the economy is thriving but prove self-defeating if remittances themselves partly drive the poor investment climate (through both economic and governance spillovers). In Nepal, remittances have failed to translate into investment at both macro and micro levels, but they are surely behind the real estate bubble that drove the financial sector to near-collapse in 2011.

We need a new, fitting and consistent narrative. The framework of the Dutch disease (and its resource curse spinoff) only go so far because remittance inflows are more sustainable than resource booms, more countercyclical and less prone to the governance problems associated with state intermediation of revenues (including aid). What we need, in other words, is a “Nepali cure” tailored to the needs of HRDCs. Can you help us find it?

The views expressed are solely those of the authors and do not necessarily reflect the views of the institutions they are associated with.

Tuesday, October 29, 2013

Doing Business 2014: Nepal ranked 105 out of 189 countries

In its latest Doing Business 2014: Understanding Regulations for Small and Medium-Size Enterprises, the IFC has ranked Singapore as the top economy in terms of ease of doing business. The other top ranked economies are  Hong Kong SAR, China; New Zealand; the United States; Denmark; Malaysia; the Republic of Korea; Georgia; Norway; and the United Kingdom.

The report ranks economies based on performance in ten indicators: starting a business, dealing with construction permits, getting electricity, registering property, getting credit, protecting investors, paying taxes, trading across borders, enforcing contracts, and resolving insolvency. This year’s report data cover regulations measured from June 2011 through May 2012.

Ukraine was the global top improver in 2013. The other economies that have made the most progress in several areas of regulation last year were Rwanda, the Russian Federation, the Philippines, Kosovo, Djibouti, Côte d’Ivoire, Burundi, the former Yugoslav Republic of Macedonia, and Guatemala


In South Asia, Sri Lanka made the most progress and was ranked 85 out of 189 economies, followed by Maldives (95), Nepal (105), Pakistan (110), Bangladesh (130), India (134), Bhutan (141), and Afghanistan (164). 

Rankings could go up or down depending on progress in business regulatory environment, progress by other countries (based on data revisions and methodology) and addition of new countries in the ranking (this year Libya, Myanmar, San Marino, and South Sudan were added).

The data for all sets of indicators in Doing Business 2014 are for June 2013 except for paying taxes data that refer to January–December 2012.


In terms of ease of doing business, Nepal ranked 105 out of 189 countries. In 2013, Nepal ranked 103 out of 185 countries. Between DB2014 and DB2013, Nepal initiated one reform in starting a business, which helped increase its ranking 6 positions in that specific indicator. Specifically, Nepal reduced the administrative processing time at the company registrar and established a data link between agencies involved in the incorporation process. However, Nepal’s ranking dropped in all other indicators (except protecting investors, on which there was no change in ranking). It appears more progress made by other economies dropped ranking of Nepal by 2 positions below last year’s ranking. Here is a blog post based on DB2013.
  • In South Asia region, Nepal has the best ranking (24) in registering property. It requires 3 procedures, 5 days and 4.9% of property value to register a property in Nepal.  The regional average is 6 procedures, 99.4 days (250 days in Afghanistan), and 7.2% of property value. 
  • In terms of documents to export, Nepal has the worst performance in the region, requiring 11 documents against the regional average of 8. Sri Lanka has the best performance with just 5 documents required for exporting a container. 
  • In terms of number of procedures required to enforce contracts, Nepal has best performance in the region with 39 required procedures as against 43 for regional average.
  • In terms of time taken to resolve insolvency, Nepal has the worst performance in the region. While it takes 5 years to resolve insolvency in Nepal, the regional average is 3 year. Furthermore, recovery rate is also the lowest in Nepal (24.5 cents on the dollar) compared 29.1 for the region (50.6 for Maldives).

Doing Business 2014: Nepal
DB rank 2014
105
out of 189 countries
DB rank 2013
103
out of 185 countries
Topic ranking (out of 189 countries)
Topics
DB 2014 Rank
DB 2013 Rank
Change in Rank
Starting a Business
97
103
6
Dealing with Construction Permits
105
97
-8
Getting Electricity
98
99
1
Registering Property
24
22
-2
Getting Credit
55
52
-3
Protecting Investors
80
80
 No change
Paying Taxes
126
121
-5
Trading Across Borders
177
173
-4
Enforcing Contracts
139
137
-2
Resolving Insolvency
125
123
-2


The report also provides a new measure called ‘distance from frontier’, which benchmarks economies to the frontier in regulatory practice. In other words, it measures the absolute distance to the best performance on each indicator. When compared across years, the distance to frontier measure shows how much the regulatory environment for local entrepreneurs in each economy has changed over time in absolute terms, while the ease of doing business ranking can show only relative change.

An economy’s distance to frontier is indicated on a scale from 0 to 100, where 0 represents the lowest performance and 100 the frontier. For example, a score of 60 in DB 2012 means an economy was 60 percentage points away from the frontier constructed from the best performances across all economies and across time. A higher score in DB 2013 indicates an improvement.

Compared to DB 2013, in DB 2014, in Nepal, there was improvement in starting a business, dealing with construction permits, getting electricity and registering property. Trading across borders worsened. There was no change in other indicators. 

TOPICS
DB 2014 DTF(% points)
DB 2013 DTF(% points)
Improvement in DTF(% points)
Starting a Business   
81.52
79.09
2.43
Dealing with Construction Permits   
76.89
75.37
1.52
Getting Electricity   
74.22
72.82
1.4
Registering Property   
84.59
84.43
0.16
Getting Credit   
68.75
68.75
No change
Protecting Investors   
53.33
53.33
No change
Paying Taxes   
64.4
64.4
No change
Trading Across Borders   
34.43
35.91
-1.48
Enforcing Contracts   
47.3
47.3
No change
Resolving Insolvency   
25.95
25.95
No change