Public investment on infrastructures, education and health are prominently featured in developing country’s fiscal budget. But, how fruitful are these investments? Does increase in public investment leads to growth? The World Bank (2007) argued that public spending on infrastructure, education, and health yields positive effects on growth. Similarly, the Commission on Growth and Development (2008) noted that fast-growing countries are characterized by high public investment, defined as 7 percent of gross domestic product (GDP) or more.
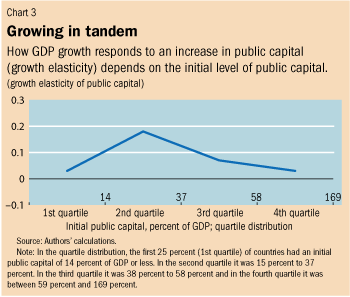
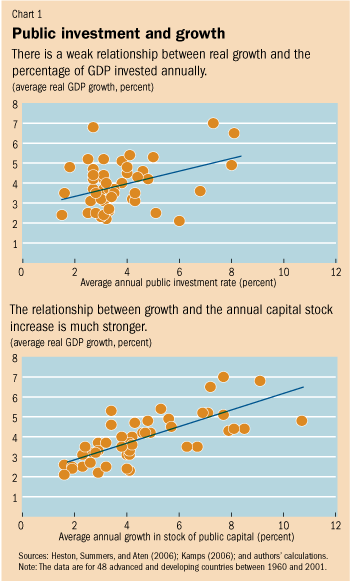
 Recently, Arslanalp, Bornhorst and Gupta (2010) studied the impact of public investment on economic growth for 48 advanced and developing economies during 1960–2001. They found that public investment generally has a positive impact on growth. Specifically, on average, GDP grew by 3.4 percent in advanced economies and 4.4 percent—1 percentage point more—in developing economies from 1960 to 2000. Here they summarize the main findings of their paper. They argue that the mixed result is resulting because most of the studies look at investment rate (% of GDP devoted to capital stock). However, the authors argue that the rate of growth of capital stock should be the focus. The capital stock—together with other production factors, such as labor and technology—determines an economy’s production potential. The investment flow in any given period, by contrast, determines how much capital is accumulated and therefore available for production in the subsequent period.
Tackling the issue of depreciation:
The value of the capital stock is calculated using the perpetual inventory method. In this method, the net capital stock—public and private—is determined by adding gross investment flows from the current period to the depreciated capital stock of the previous period. As a result, the stock data account for the wear and tear on assets.The choice of depreciation rates presents perhaps the biggest challenge to tallying the capital stock data—mainly because country-specific estimates of depreciation rates (how much of the capital stock is used up in a period) are typically not available. Instead of applying a uniform rate to all countries, we differentiate the assumed depreciation by groups of countries reflecting different types of assets typically available in those countries. These assets have different life spans, resulting in different depreciation rates. For example, concrete structures are typically estimated to last longer than assets related to technology, whose investment life may be only a few years. As countries become richer, the share of assets with shorter life spans rises, thereby raising the overall depreciation rate.
The U.S. Bureau of Economic Analysis estimates that overall depreciation rates for public capital in the United States were about 2½ percent per year in 1960 and 4 percent in 2001 (Bureau of Economic Analysis, 2010). We extended this assumption to the public capital stock estimates for all advanced economies in our sample. For middle-income countries, we used a time-varying profile in which the depreciation rate starts at 2½ percent in 1960 and reaches 3½ percent by 2001. We assumed a constant rate of depreciation of 2½ percent for low-income countries throughout the sample period. We confirmed our findings using other plausible depreciation rates.

The correlation between average public capital growth and average GDP growth is much higher than between the average public investment rate and GDP growth.

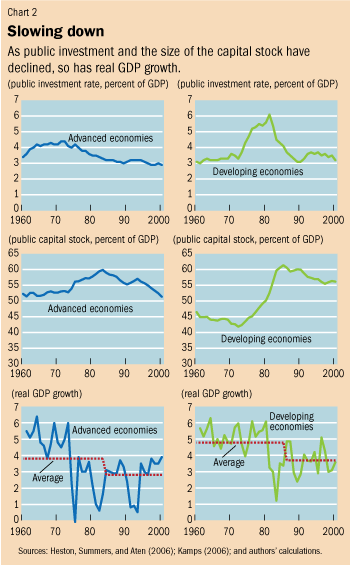
It shows that the public investment rate has been on a downward trend since the early 1970s in advanced economies. In contrast, the public investment rate increased significantly in developing countries in the 1970s, although it returned to its earlier levels in the 1980s. Public capital stock, as a percent of GDP, peaked for advanced economies in 1983 and for developing economies in 1985. The peak levels were 60 percent of GDP for advanced economies and 61 percent of GDP for developing economies.