Saturday, September 26, 2015

The 17 Sustainable Development Goals (SDGs)

Here is the list of the 17 SDGs agreed this week at the UN. There are many targets within each group. SDGs are the set of long term global development goals. They succeeded the MDGs.

  1. End poverty in all its forms everywhere
  2. End hunger, achieve food security and improved nutrition and promote sustainable agriculture
  3. Ensure healthy lives and promote well-being for all at all ages
  4. Ensure inclusive and equitable quality education and promote lifelong learning opportunities for all
  5. Achieve gender equality and empower all women and girls
  6. Ensure availability and sustainable management of water and sanitation for all
  7. Ensure access to affordable, reliable, sustainable and modern energy for all
  8. Promote sustained, inclusive and sustainable economic growth, full and productive employment and decent work for all
  9. Build resilient infrastructure, promote inclusive and sustainable industrialization and foster innovation
  10. Reduce inequality within and among countries
  11. Make cities and human settlements inclusive, safe, resilient and sustainable
  12. Ensure sustainable consumption and production patterns
  13. Take urgent action to combat climate change and its impacts
  14. Conserve and sustainably use the oceans, seas and marine resources for sustainable development
  15. Protect, restore and promote sustainable use of terrestrial ecosystems, sustainably manage forests, combat desertification, and halt and reverse land degradation and halt biodiversity loss
  16. Promote peaceful and inclusive societies for sustainable development, provide access to justice for all and build effective, accountable and inclusive institutions at all levels
  17. Strengthen the means of implementation and revitalize the global partnership for sustainable development


The targets within Goal #8 (Promote sustained, inclusive and sustainable economic growth, full and productive employment and decent work for all) are as follows:

8.1. Sustain per capita economic growth in accordance with national circumstances and, in particular, at least 7 per cent gross domestic product growth per annum in the least developed countries

8.2. Achieve higher levels of economic productivity through diversification, technological upgrading and innovation, including through a focus on high-value added and labour-intensive sectors

8.3. Promote development-oriented policies that support productive activities, decent job creation, entrepreneurship, creativity and innovation, and encourage the formalization and growth of micro-, small- and medium-sized enterprises, including through access to financial services

8.4. Improve progressively, through 2030, global resource efficiency in consumption and production and endeavour to decouple economic growth from environmental degradation, in accordance with the 10-year framework of programmes on sustainable consumption and production, with developed countries taking the lead

8.5. By 2030, achieve full and productive employment and decent work for all women and men, including for young people and persons with disabilities, and equal pay for work of equal value

8.6. By 2020, substantially reduce the proportion of youth not in employment, education or training

8.7. Take immediate and effective measures to eradicate forced labour, end modern slavery and human trafficking and secure the prohibition and elimination of the worst forms of child labour, including recruitment and use of child soldiers, and by 2025 end child labour in all its forms

8.8. Protect labour rights and promote safe and secure working environments for all workers, including migrant workers, in particular women migrants, and those in precarious employment

8.9. By 2030, devise and implement policies to promote sustainable tourism that creates jobs and promotes local culture and products

8.10. Strengthen the capacity of domestic financial institutions to encourage and expand access to banking, insurance and financial services for all

8.a. Increase Aid for Trade support for developing countries, in particular least developed countries, including through the Enhanced Integrated Framework for Trade-Related Technical Assistance to Least Developed Countries

8.b. By 2020, develop and operationalize a global strategy for youth employment and implement the Global Jobs Pact of the International Labour Organization
Migration, remittances and balance of payments post April 25 earthquake in Nepal

This is adapted from Macroeconomic Update, August 2015, Vol.3, No.2 (executive summary here, and FY2016 growth and inflation outlook here). It presents is the composition of Nepal’s outstanding internal and external debt. The Macroeconomic Update includes FY2015 update on real, fiscal, monetary and external sector, and growth and inflation outlook for FY2016. It provides a comprehensive macroeconomic assessment, including fiscal sustainability, after the April 25 earthquake.


I. Remittances

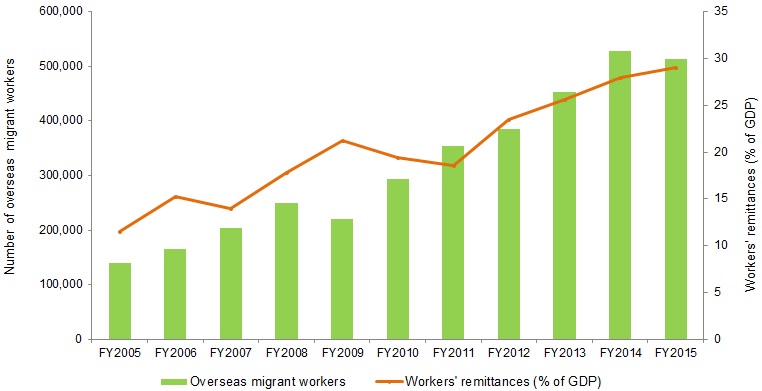
Despite the deceleration of remittance inflows till the third quarter of FY2015, the earthquake in the last quarter prompted migrant workers to drastically increase the amount of income remitted to Nepal. Consequently, workers’ remittance inflows reached a record 29.1% of GDP in FY2015, equivalent to $6.2 billion (Figure 1). In US$ terms, remittance inflows grew by 12.2%, marginally up from 11.9% growth in FY2014.[1] This follows a 16.4% growth of migrant workers (those who obtained permits form the Department of Foreign Employment).

Figure 1: Number of migrants and remittance inflows

II. Migration

According to the Department of Foreign Employment, growth of migrant workers decreased by 2.8% (Table 1) against a growth of 16.4% in FY2014 as recruitment process got derailed for over a month and potential migrant workers deferred travel plans in view of the immediate relief and temporary reconstruction works needed in the earthquake affected areas. A total of 512, 887 migrants legally left to work overseas in FY2015 (daily average of 1,405), down from 527,814 in FY2014 (daily average of 1,466). Malaysia, Qatar, Saudi Arabia, and UAE have remained the top employment destinations for low and semi-skilled Nepalese migrant workers (Figure 2). They together accounted for 92% of total migrant workers in FY2015. As a share of total migrants, Malaysia’s share increased from 34.6% in FY2013 to 40.6% in FY2014, but declined to 39.5% in FY2015. Meanwhile, Qatar’s share also decreased from 24.4% in FY2014 to 24.2% in FY2015. Saudi Arabia, Japan and South Korea absorbed higher share of migrant workers when compared to the shares in FY2014.

Figure 2: Destination-wise distribution of labor migrants

Table 1: Monthly out-migration

Number of migrants Y-o-Y growth
mid-month FY2014 FY2015 FY2014 FY2015
August     45,519     42,309 39.3 -7.1
September     24,214     51,551 -13.8 112.9
October     31,959     35,550 -15.9 11.2
November     31,949     43,213 24.7 35.3
December     41,634     53,354 19.1 28.2
January     50,032     45,362 22.4 -9.3
February     37,285     48,941 -0.5 31.3
March     48,552     44,460 24.2 -8.4
April     45,854     52,210 10.1 13.9
May     54,173     31,375 37.9 -42.1
June     54,926     37,962 21.0 -30.9
July     61,717     26,600 22.3 -56.9
Total   527,814  512,887 16.4 -2.8

III. Balance of payments

Despite the weak currency, which improved relative price competitiveness, exports failed to pick up in the first three quarters and then plunged drastically as production got severely affected by the April earthquake and its aftershocks. Merchandise exports (free on board [fob]), in US dollar terms, decreased by 3.9%-- a sharp fall from 5.1% growth in FY2014. The country exported merchandise goods worth $990.8 million, down from $1.03 billion in FY2014. Overall, merchandise exports decreased to 4.6% of GDP in FY2015 from 5.2% of GDP in FY2014. Exports to India, the People’s Republic of China (PRC), and other countries accounted for 65.5%, 2.6% and 31.9%, respectively, of total exports in FY2015.

Merchandise imports growth (cost, insurance freight [cif]) in dollar terms slowed down to 8.0% from 13.9% growth in FY2014 as it got hit due to the severe disruption in economic activities and a slump in import demand following the earthquake. Of the total imports of $7.6 billion, 14.7% was oil imports. In US dollar terms, this is equivalent to $1.1 billion, higher than the value of the country’s total merchandise exports but lower than the oil import bill in FY2014. This is primarily due to the low international oil prices and the weakening of aggregate demand in the last quarter of FY2015. Overall, merchandise imports stayed unchanged at 35.9% of GDP in FY2015 and FY2014. Imports from India, PRC, and other countries accounted for 63.5%, 12.9% and 23.6%, respectively, of total imports in FY2015.

Figure 3: Balance of payments (% of GDP)

The country’s external situation strengthened in FY2015 with the balance of payment surplus reaching $1.5 billion (6.8% of GDP). Though this is an impressive increase from the $1.3 billion (6.5% of GDP) surplus in FY2014, it is still lower than the $1.6 billion (8.2% of GDP) surplus in FY2012 (Figure 3). The large merchandise trade deficit, which reached 31.2% of GDP, was partially[2] offset by workers’ remittances, which reached a record 29.1% of GDP, and export (4.6% of GDP), resulting in a current account surplus of $1.1 billion (5.1% of GDP), up from 4.6% of GDP in FY2014. While capital transfers decreased by 14.3%, financial transfers increased by 57.0% as a result of the 35.5% jump in foreign direct investment, amounted to $44.2 million. Gross foreign exchange reserves increased from $6.8 billion in FY2014 to $8.3 billion FY2014, sufficient to cover 11.2 months of imports of goods and non-factor services.


[1] In local currency, the growth rate was 13.6% in FY2015, down 25.0% growth in FY2014.

[1] Overall, the net goods, services and income balance was a negative 28.3% of GDP, which was offset by net transfers equivalent to 33.4% of GDP, resulting in current account surplus equivalent to 5.1% of GDP.