Tuesday, May 31, 2011

Trade Policy, Welfare and MFN

This blog post is adapted from Robert C. Feenstra’s summary of research of the International Trade and Investment (ITI) Program at NBER. It summarizes various papers that explore and explain the causes of the great trade collapse of 2009. Here is a blog post about what economists thought were the reasons for the collapse in trade by about 30 of world GDP in 2009. Here is an earlier blog post adapted from Feenstra’s summary of recent literature on the great trade collapse of 2009.


In the ITI program an ongoing area of research is the impact of, and explanations for, trade policies. Some studies examine the impact of policies in particular sectors. One important example is the textile and apparel sector, which experienced a large reduction in quotas as the Multifibre Agreement was phased out in January 1, 2005. Many people expected that China would take over in this sector, since it had been the most constrained in its textile and apparel exports. But Harrigan and Geoffrey Barrows show that along with these changes in market shares, there was a massive downgrading in the type of product exported from China.1 These products at the lower end took sales away from countries such as Mexico or Guatemala, and to some extent served to offset the competitive impact on other Asian countries.

Another sector that has received attention for its ongoing trade policies is steel. Bruce Blonigen and co-authors show that the response of this industry to tariffs versus quotas, which they estimate, is highly sensitive to its market structure.2

Another topic of strong interest is the impact of free trade agreements, particularly on workers. This topic has received renewed interest for the United States in what might be considered "round two" of the debate over the impact of trade on wages and employment. Making use of broad changes in tariffs through trade agreement and detailed datasets on individuals, these studies identify potentially large effects of tariff reductions. A recent example is the work by David Autor, David Dorn, and Hanson, which examines the acceleration in Chinese exports to the United States following its WTO accession in 2001.3 They match the changes in wages and employment in local labor markets defined by "commuting zones" to the Chinese exporters to manufacturing industries in those zones. They link the rise in Chinese exports, and the implied reduction in employment, to changes in federal support payments to individuals for trade adjustment assistant, disability, retirement, and the like. They find that the deadweight loss from the increase in support payments is very similar in magnitude to the welfare gains from the increased imports: both are on the order of $30 - $70 annually per capita. But because the support payments are expected to be temporary while the welfare gains from imports are permanent, there are still gains from trade.

A second example of a study that uses data on individuals (from the decennial census) is the paper by John McLaren and Shushanik Hakobyan which analyzes the impact of NAFTA on local labor markets in the United States.4 Drawing on earlier theoretical work by McLaren, they allow for possible wage increases in response to anticipated tariffs cuts (as workers leave industries) and for wage decreases when the tariff cut occurs. They find a significant negative impact of NAFTA on blue-collar workers, with smaller positive or negative effects on college educated workers. Their overall message is that NAFTA has large distributional effects, even if its overall welfare impact is small.

All of these studies find sizable changes in trade flows following the enactment of the tariff changes, despite the fact that U.S. tariffs on Mexico were already low, and that tariffs on China were already at their MFN level before its accession to the WTO. Why can trade change so much in response to small tariff changes? Kyle Handley and Nuno Limao suggest that preferential agreements may reduce the policy uncertainly surrounding tariffs that could change in the future.5 They study Portugal, which was already a member of the EFTA and had an agreement with Spain when it joined the EEC in 1986. There was no drop in Portugal's tariffs with members of the EEC who were also in EFTA, but nevertheless there was a sizable increase in exports to EC members. Handley and Limao attribute this to a reduction in policy uncertainty, which they measure by the difference in the zero tariffs within the EEC and the MFN tariffs charged to outside members. Variation in that difference allows the researchers to identify the policy impact across industries and to explain the increase in trade.

In addition to these empirical studies, several members of the program, using game-theoretic techniques, have theoretically analyzed the question of why countries pursue preferential agreements. For example, Philippe Aghion, Antras, and Helpman model this as a question of sequential bargaining, whereby a country makes deals with a series of other countries, but the bargains negotiated must be consistent with the deals that potentially will be made in the future.6 The researchers show that this model generates both "building bloc" and "stumbling bloc" effects of preferential trade agreements, to use the terminology of Jagdish Bhagwati. In particular, they find conditions under which global free trade is attained when preferential trade agreements are permitted to form (a building bloc effect), and other conditions where global free trade is attained only when preferential trade agreements are forbidden (a stumbling bloc effect).

In a series of papers, Kyle Bagwell and Robert Staiger analyze games in which countries are constrained by the WTO rules and show that these rules can lead to welfare improvements.7 One example is the most-favored nation rule, which states that all WTO members must be treated equally. This rule means that a reduced trade barrier given to a current negotiating partner must be automatically extended to later partners. Bagwell and Staiger argue that the MFN principle makes it less likely for countries to be willing to offer concessions at early stages of the sequential bargaining process, but that this potential source of conflict can be offset by two other WTO principles: first, by renegotiation at later stages; second, by reciprocity in the concessions made by each country. Incorporating these principles into the bargaining game allows for an efficient outcome even under the MFN rule. This line of research enables Bagwell and Staiger to rationalize various provisions of the WTO.

There are other approaches, too, that can be used to rationalize the provisions to the WTO. Ralph Ossa uses a monopolistic competition model with a "home market" effect, whereby tariffs attract firms to enter the protected market.8 That framework can generate political economy considerations for trade policies and WTO rules that are similar to what arises from the terms-of-trade model. Using a different approach, Giovanni Maggi and his co-authors argue that WTO-type rules can be understood as arising from the inevitable incompleteness of trade agreements.9

The analysis of trade policy naturally leads to the question of the gains from international trade, and we conclude with this classic question. Analysis of the monopolistic competition model has shown that it gives rise to a remarkably simple formula for the gains from opening trade: those gains are equal to one minus the import share of the economy, raised to a negative power that depends on the specific details of the model. In the Krugman monopolistic competition model with homogeneous firms, that power depends on the elasticity of substitution in consumption. In the Melitz model with heterogeneous firms that have a Pareto distribution for productivities, the same formula for the gains from trade holds, but the power depends on the Pareto parameter.10 I argue that this result obtains in the Melitz model because import competition drives out a number of domestic varieties that just cancel out in welfare terms, so that the only remaining source of gains from trade is productivity improvements.11 Remarkably, Arkolakis, Costinot, and Andres Rodriguez-Clare have recently argued that a similar result holds in a broader class of models. The fact that such a simple formula for the gains from trade arises in models that can be quite complex in their market structure leads them to pose the question: "new trade models, same old gains?"12

This view has been challenged in other recent work. Weinstein and I estimate a monopolistic competition model with heterogeneous firms, where the aggregate consumer has translog preferences.13 In that case, the markups charged by firms are endogenous, and we do not expect that the gains from trade depend only on the import share. We estimate the gains from rising imports over 1992-2005 for the U.S. economy, and find that the gains from reduced markups are on the same order of magnitude as the gains attributable to increased import variety.

Ina Simonovska also obtains variable markups, as discussed above, as do Beatriz de Blas and Katheryn Russ in the context of the model by Bernard, Eaton, Jensen, and Kortum.14 In that model, Bertrand competition leads to markups that equal the difference between the productivity of the most efficient and second-most efficient firms. But with entry by a finite number of potential rivals, de Blas and Russ show that these markups are not fixed by the productivity distribution of firms, but depend on the number of rivals. If opening to trade alters the number of potential rivals, then markups will also change. In that case, we can conjecture that the gains from trade will not depend on only the import share and a parameter. Understanding the class of models in which this conjecture holds true is an important direction for further research.

1J. Harrigan and G. Barrows, "Testing the Theory of Trade Policy: Evidence from the Abrupt End of the Multifibre Arrangement," NBER Working Paper No. 12579, October 2006, and in The Review of Economics and Statistics, vol. 91(2) (November 2009), pp. 282-94.

2B. Blonigen, B. H. Liebman, J. R. Pierce, and W. W. Wilson, "Are All Trade Protection Policies Created Equal? Empirical Evidence for Nonequivalent Market Power Effects of Tariffs and Quotas," NBER Working Paper No. 16391, September 2010.

3D. H. Autor, D. Dorn, and G. Hanson, "The China Syndrome: Local Labor Market Effects of Import Competition in the U.S.," presented at the International Trade and Investment Program Meeting, March 25-26, 2011.

4J. McLaren and S. Hakobyan, "Looking for Local Labor-Market Effects of the NAFTA," NBER Working Paper No. 16353, November 2010.

5K. Handley and N. Limao, "Trade and Investment under Policy Uncertainty: Theory and Firm Evidence," presented at the International Trade and Investment Program Meeting, March 25-26, 2011.

6P. Aghion, P. Antras, and E. Helpman, "Negotiating Free Trade," NBER Working Paper No. 10721 September 2004, and in Journal of International Economics, vol. 73(1) (September 2007), pp. 1-30.

7K. Bagwell and R. W. Staiger, "What Do Trade Negotiators Negotiate About? Empirical Evidence from the World Trade Organization," NBER Working Paper No. 12727, December 2006; P. Antras and R. W. Staiger, Offshoring and the Role of Trade Agreements," NBER Working Paper No. 14285, August 2008; K. Bagwell and R. W. Staiger, "Profit Shifting and Trade Agreements in Imperfectly Competitive Markets," NBER Working Paper No. 14803, March 2009; K. Bagwell, "Self-Enforcing Trade Agreements and Private Information," NBER Working Paper No. 14812, March 2009; K. Bagwell and R. W. Staiger,"Delocation and Trade Agreements in Imperfectly Competitive Markets," NBER Working Paper No. 15444, October 2009; K. Bagwell and R. W. Staiger, "The WTO: Theory and Practice," NBER Working Paper No. 15445, October 2009; K. Bagwell and R. W. Staiger, "The Economics of Trade Agreements in the Linear Cournot Delocation Model," NBER Working Paper No. 15492, November 2009; R. W. Staiger and A. O. Sykes, "International Trade and Domestic Regulation," NBER Working Paper No. 15541, November 2009.

8R. Ossa, "A 'New Trade' Theory of GATT/WTO Negotiation," NBER Working Paper No. 16388, September 2010.

9H. Horn, G. Maggi, and R. W. Staiger, "Trade Agreements as Endogenously Incomplete Contracts," NBER Working Paper No. 12745, December 2006, and in American Economic Review, vol. 100(1) (March 2010), pp. 394-419; G. Maggi and R. W. Staiger, "On the Role and Design of Dispute Settlement Procedures in International Trade Agreements," NBER Working Paper No. 14067, June 2008; G. Maggi and R. W. Staiger, "Breach, Remedies and Dispute Settlement in Trade Agreements," NBER Working Paper No. 15460, October 2009.

10C. Arkolakis, S. Demidova, P. J. Klenow, and A. Rodriguez-Clare, "Endogenous Variety and the Gains from Trade" NBER Working Paper No. 13933, April 2008, and in American Economic Review, vol. 98(2) (May 2008), pp. 444-50.

11R. C. Feenstra, "Measuring the Gains from Trade under Monopolistic Competition," NBER Working Paper No. 15593, December 2009, and Canadian Journal of Economics, 43(1), (February 2010), pp. 1-28.

12C. Arkolakis, A. Costinot, and A. Rodriguez-Clare, "New Trade Models, Same Old Gains?" NBER Working Paper No. 15628, December 2009, and forthcoming, American Economic Review.

13R. C. Feenstra and D. E. Weinstein, "Globalization, Markups, and the U.S. Price Level," NBER Working Paper No. 15749, February 2010.

14B. de Blas and K. Russ, "Teams of Rivals: Endogenous Markups in a Ricardian World" NBER Working Paper No. 16587, December 2010; A. B. Bernard, J. Eaton, J. B. Jensen, and S. Kortum, "Plants and Productivity in International Trade," NBER Working Paper No. 7688, May 2000, and American Economic Review, vol. 93(4) (September 2003), pp.1268-90.
21st century regionalism and the WTO

Richard Baldwin argues that:


  • today regionalism is qualitatively different to that of the 1990s;
  • the traditional building-stumbling-block approach and Vinerian economics on which it is premised are not up to the job of analysing this new regionalism; and
  • 21st century regionalism has quite different ramifications for the world trading system than 20th century regionalism did.

In a nutshell, 21st century regionalism is not primarily about preferential market access as was the case for 20th century regionalism; it is about disciplines that underpin the trade-investment-service nexus. This means that 21st century regionalism is driven by a different set of political economy forces; the basic bargain is “foreign factories for domestic reforms” – not “exchange of market access”. As 21st century regionalism is largely about regulation rather than tariffs, regulatory economics is needed rather than Vinerian tax economics. Finally, 21st century regionalism is a serious threat to the WTO’s centrality in global trade governance, but not for the reason suggested by the old building-stumbling-block thinking. 21st century regionalism is a threat to the WTO’s role as a rule writer, not as a tariff cutter.


Here is a link to Baldwin’s paper 21st Century Regionalism: Filling the gap between 21st century trade and 20th century trade rules

Saturday, May 28, 2011

Food deficit districts in Terai region of Nepal

The Terai region is considered as the ‘bread basket’ of Nepal. However, it too is facing deficit food production this year. Even the ten major food surplus districts in the Terai region have insufficient production right now. A total of 43 out of 75 districts are facing food deficit in Nepal.

Since the major food producing region itself is facing food deficit, it will impact food availability and food security throughout the country. Also, food import bills will rise, further increasing total trade deficit. The table below shows that Mountain and Hill regions have deficit food production. Apart from the production in Terai region, a large amount is imported to meet total food demand. [Note that one ton= 1000 kg and 1mt = 10^6 tons].

Cereal production (mega tons) in FY 2009/10
Region Total edible production Total requirement Balance % balance of total requirement
Mountain 279765 376982 -97217 -26
Hill 2040441 2451345 -410904 -17
Terai 2647263 2469117 178149 7
TOTAL 4967469 5297444 -329972 -6.23

Food insufficient districts in Terai region: Sunsari, Saptari, Siraha, Dhanusa, Mahottari, Sarlahi, Rautahat, Chitwan, Dang and Kailali

Districts with decreasing food surplus in Terai region: Jhapa, Morang, Bara, Parsa, Nawalparasi, Banke, Bardia, Kapilvastu, Rupandehi and Kanchanpur

Reason for deficit production: uncontrolled urbanization and plotting of agriculture land for real estate

Nepal imported 350,000 tons of food grains during fiscal year 2009/10. Nepal´s average food grains import for the past five years before 2009/10 was 250,000 tons a year. The government had estimated food deficit of 316,000 tons across the country in 2009/10.

Good prospect in FY 2010/11 (adapted from Republica)


Buoyed by 11 percent rise in cereal crop production in 2009/10, the government expects food surplus of 10,000 to 15,000 tons in 2010/11. The government has put paddy, maize, wheat, millet, barley and buckwheat under cereal crop category.The MoCA has projected rise in production of all crops except jute, tobacco and black cardamom.

According to MoCA´s projections, total cereal production increased to 8.61 million tons during 2010/11, up from 7.76 million tons recorded in the last fiscal year. Maize and paddy production increased by 10.85 percent and 11.45 percent respectively to 4.46 million tons and 2.06 million tons respectively compared to the figures of last year.

Production of wheat increased by 12 percent to 1.74 million tons, while barley production rose by 10 percent to 30,000 tons. Production of millet and buckwheat increased to 303,000 tons and 8,841 tons respectively.

Reason for good harvest: favorable monsoon, increasing use of improved seeds, easy availability of chemical fertilizers and lower rates of crop damage due to natural disasters.


Thursday, May 26, 2011

16 Things You Didn't Know About Africa

  1. The largest population in Sub-Saharan Africa (SSA) is 151.3 million in NIGERIA. The smallest is 0.1 million (100,000) in Seychelles.
  2. Total trade as a percentage of gross domestic product (GDP) is the highest in Seychelles: 283.4 percent and lowest in Central Africa Republic: 37.5 percent.
  3. In two thirds of SSA countries, only one or two products are responsible for 75 percent or more of the country’s total exports.
  4. Cape Verde receives the highest net official development assistance (ODA ) per capita: $438.20. Nigeria receives the lowest: $9.50.
  5. The percentage of parliamentary seats held by women is highest in Rwanda with 56.3 percent, and lowest in São Tomé and Príncipe with 1.8 percent.
  6. Only 5.7 percent of births in Ethiopia are attended by skilled personnel compared to 98.4 percent in Mauritius.
  7. Youth literacy (ages 15-24) is highest in Gabon at 97 percent and lowest inBurkina Faso at 39.3 percent.
  8. The highest connection charge for a business phone is $366.60 in Benin. The lowest is in Ghana at $0.70.
  9. In South Africa there are 924 mobile phones per 1000 people. In Eritrea there are 22 per 1000 people.
  10. In Côte d’Ivoire it takes 16.6 days on average to clear customs on direct exports, compared with 3.8 days in Gabon. Imports, on the other hand, take 31.4 days to clear customs in the Republic of Congo, compared to 4.4 days in Lesotho.
  11. The percentage of firms that identify corruption as a major constraint to doing business was highest in Côte d’Ivoire at 75.0 percent, while the lowest is in Ghana with 9.9 percent.
  12. In Chad, 37 percent of children who start first grade make it to the fifth grade, versus 99 percent in Mauritius.
  13. In Sierra Leone 272 out of every 1,000 children die before the age of five. In Seychelles, the number is 13 per 1,000.
  14. In Somalia, 29 percent of the population has access to a safe source of water. In Mauritius, access is 100 percent.
  15. In Sierra Leone, 3 persons per 1,000 are Internet users. In Seychelles, where there were 212 computers per 1,000 people for the period 2005-2007, 371 in every 1,000 people are Internet users.
  16. South Africa has the highest carbon dioxide emissions: 414,649 metric tons, while Comoros has the lowest: 88 metric tons.

Adapted from Development Outreach

Wednesday, May 25, 2011

Inter-sectoral productivity gaps and structural change

Structural change happens when an economy shifts its sources of growth and employment from agriculture to non-agriculture activities. As factors of production (labor and capital) move away from agriculture into modern economic activities overall productivity rises and incomes expand. The rate at which overall productivity rises in different non-agriculture activities (inter-industry productivity gaps) plays a vital role in bringing about and sustaining this change. [Productivity is defined as the ratio of each sector’s value added to employment in that sector.]

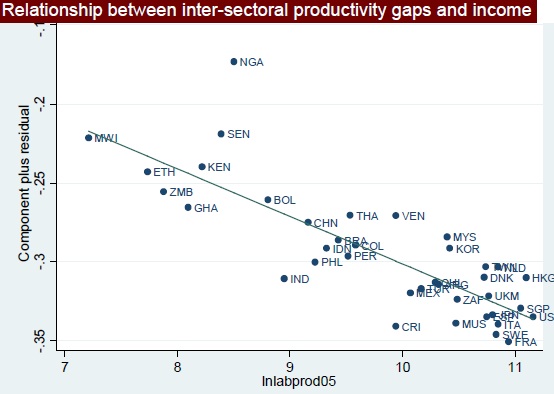
When compared to developed countries, developing countries are characterized more by large productivity gaps among firms and plants within same industry. This is indicative of allocative inefficiencies that reduce overall labor productivity. The inter-sectoral productivity gaps (the differences in average labor productivity) are a feature of underdevelopment.

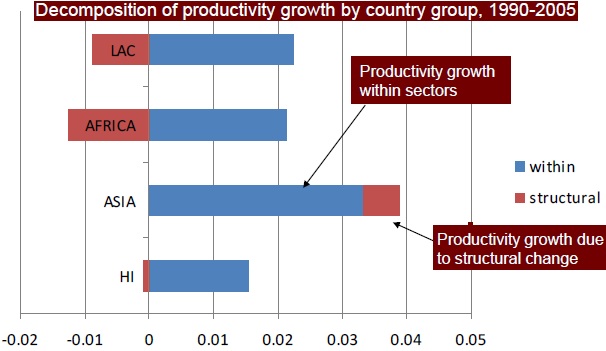
But, productivity gaps among firms in the same or different industry can be an important source of growth, argues Rodrik and McMillan (2011) in the latest working paper (Globalization, Structural Change, and Productivity Growth). The reason is that when factors of production (mostly labor and capital) move from less productive to more productive activities, the economy grows even if there is no productivity growth within sectors. The movement of labor from low-productivity to high-productivity activities raises economy-wide labor productivity. This is growth-enhancing structural change, which the high-income countries have. The main messages of their paper are:

  • In many Latin American and Sub-Saharan African countries broad patterns of structural change have served to reduce rather than increase economic growth since 1990. Factors of production (labor) are moving into less productive sectors (informal and agriculture) from more productive ones in these regions. The opposite happened and is happening in Asia. This is especially true after trade liberalization as competition forced firms to exit the market, forcing them to lay off workers who ended up in the informal sector and low paying services job. [This is happening in Nepal as well. A number of garment workers that were laid off beginning 2000 have gone into the informal sector where wages are low.] The average manufactures-agriculture productivity ratio is 2.3 in Africa, 2.8 in Latin America, and 3.9 in Asia.
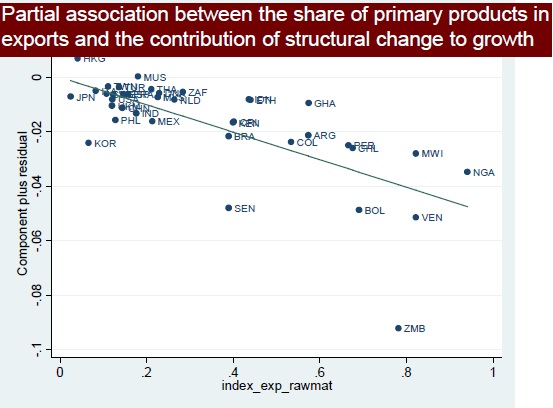
  • Factors that help determine if structural change is going in the right direction (and policy intervention might help): (i) Economies with relative comparative advantage (RCA) in primary products are at a disadvantage as their large share of natural resource exports means that the scope of productivity-enhancing structural change is narrow. These sectors cannot absorb much surplus labor form agriculture. (ii) Countries that maintain competitive or undervalued currencies tend to experience more growth-enhancing structural change as there is positive effect of undervaluation on modern, tradable industries. (iii) Countries with more flexible labor markets have greater growth-enhancing structural change as rapid structural change occurs when labor mobility across firms and sectors is high. [(ii) and (iii) is true in the case of Nepal; (i) may be true if we starting producing hydroelectricity and export it to India like Bhutan is doing.]
  • Agriculture is the sector with the lowest productivity in poorest economies.
  • During economic growth the productivity gap between agricultural and non-agricultural sectors first increases and then falls, exhibiting a U-shaped pattern (ratio of agricultural to non-agricultural productivity with respect to economy-wide labor productivity). The turning point comes at an economy-wide productivity level of around $9000—a development level somewhere between that of India and China. Initially, there is no large productivity gap between agricultural and non-agricultural sectors in poor countries. As economy grows, labor begins to move from traditional to modern sectors, thus leading to convergence of productivity levels across sectors in the economy [First, labor moves from agri to non-agri sector, increasing productivity in non-agri sector and also in agri sector (due to less labor). Then, diminishing marginal returns kicks in in the non-agri sector. Eventually, productivity level converges within sectors and also within countries with same income levels.]

  • Differential pattern of structural change account for a bulk of the difference in regional growth rates.
  • Domestic convergence, just like convergence with rich countries, is not an unconditional process. Starting out with a high share of labor force in agriculture may increase the potential for structural-change induced growth (not applicable to those having strong comparative advantage in primary products), but the mechanism is clearly not automatic.

This paper contributes Hausmann’s and his work on structural change induced by “jumping monkeys”, where production is moved from one product to another having similar features and using pretty much similar (or upgraded) factors of production. It involves (structural change) moving from the production of peripheral goods to core goods in product space.

Tuesday, May 24, 2011

Causes of the Great Trade Collapse of 2009

This blog post is adapted from Robert C. Feenstra’s1 summary of research of the International Trade and Investment (ITI) Program at NBER. It summarizes various papers that explore and explain the causes of the great trade collapse of 2009. Here is a blog post about what economists thought were the reasons for the collapse in trade by about 30 of world GDP in 2009.


The financial crisis and great recession of 2008-9 brought with it a "great trade collapse": world trade relative to GDP fell by nearly 30 percent between these two years, exceeding the experience of other post-war recessions. Why did trade fall so much, and why did it recover relatively quickly? The leading explanations stress, in varying degrees, the roles of: inventory adjustment for imports; demand for durable versus non-durable goods; the use of intermediate inputs in trade, which might magnify the impact on trade as "supply chains" are temporarily disrupted; and the role of trade credit, which appears to have dried up temporarily during the crisis.

Beginning with the last of these explanations, Kalina Manova and her co-authors provide the strongest evidence supporting the role of credit constraints on exports. These constraints limit the extensive margin of exports in sectors that are most vulnerable to financial stress.2 Furthermore, she argues that such sectors faced greater reductions in their exports to the U.S. market during the financial crisis. 3 That idea is confirmed for Japan by Mary Amiti and David Weinstein.4 They find that Japanese exporters faced greater reductions in their sales abroad if they were affiliated with main banks that performed poorly. Focusing on China, my co-authors and I find that firms faced tighter credit constraints on their exports than on their domestic sales, and that exports experienced a significant slowdown because of the 2008 crisis.5 Ann E. Harrison and her co-authors find that, for the United States, import prices often rose during the crisis, which is inconsistent with falling demand but can arise from a supply constraint, such as a lack of export credit.6

Other work casts some doubt on the importance of export credit. George Alessandria and co-authors instead stress the role of inventory adjustment, which can lead to a rapid fall in imports as stocks are adjusted downwards.7 Andrei Levchenko, Logan Lewis, and Linda Tesar also find a limited role for trade credit in their regression analysis of U.S. trade, but they use an accounting definition of "trade credit" that applies equally well to exports or domestic sales.8 As an alternative explanation, they find that sectors which are more reliant on imported intermediate inputs suffered more during the crisis, because these supply chains were temporarily disrupted. Fabio Ghironi and his co-authors also stress the importance of imported inputs. They model the different components of aggregate demand (consumption, investment, government spending, and exports) as having different import intensities.9 They then construct a weighted average of those factors with the weights reflecting their import intensities. Using the resulting variable as an income term, and including an import price, they are able to construct a model that predicts the fluctuations in import demand during the current crisis and earlier episodes much more accurately than do conventional methods that rely on GDP and aggregate prices.

Of course, in the end it will be a combination of factors that explain the great trade collapse: even if inventories or imported intermediates are more important quantitatively, that finding need not detract from the significance of trade credit. Amiti and Weinstein, for example, argue that trade credit can account for about 20 percent of the fall in exports for Japan, so it was not the most important factor, but it was still economically significant. That point is also made for Peruvian exports by Veronica Rappoport and co-authors, who argue that the reduction in loans from banks performing poorly reduced aggregate exports by 15 percent during the crisis.10 Perhaps the most comprehensive evaluation of the different factors contributing to the great collapse in trade was written by Jonathan Eaton, Sam Kortum, Brent Neiman, and John Romalis.11 They argue that the relative decline in demand for manufactures was the most important driver of the decline in manufacturing trade, and especially the decline in demand for durable manufactures. These factors account for more than 80 percent of the global decline in trade/GDP. While they find that trade frictions increased and played an important role in reducing trade in some countries, notably China and Japan, these frictions only had a small impact on global trade.

1 Feenstra directs the NBER's Program on International Trade and Investment and is a Distinguished Professor of Economics at the University of California, Davis.

2 K. Manova, "Credit Constraints, Heterogeneous Firms, and International Trade," NBER Working Paper No. 14531, December 2008.

3 D. Chor and K. Manova, "Off the Cliff and Back? Credit Conditions and International Trade during the Global Financial Crisis," NBER Working Paper No. 16174, July 2010.

4 M. Amiti and D. E. Weinstein, "Exports and Financial Shocks," NBER Working Paper No. 15556, December 2009.

5 R. C. Feenstra, Z. Li, and M. Yu, "Exports and Credit Constraints under Incomplete Information: Theory and Evidence from China," NBER Working Paper No. 16940, April 2010.

6 M. Haddad, A. E. Harrison, and C. Hausman, "Decomposing the Great Trade Collapse: Products, Prices, and Quantities in the 2008-2009 Crisis," NBER Working Paper No. 16253, August 2010.

7 G. Alessandria, J. P. Kaboski, and V. Midrigan, "The Great Trade Collapse of 2008-09: An Inventory Adjustment?" NBER Working Paper No. 16059, June 2010.

8 A. A. Levchenko, L.T. Lewis, and L. L. Tesar, "The Collapse of International Trade During the 2008-2009 Crisis: In Search of the Smoking Gun," NBER Working Paper No. 16006, May 2010.

9 M. Bussiere, G. Callegari, F. Ghironi, G. Sestieri, and N. Yamano, "Estimating Trade Elasticities: Demand Composition and the Trade Collapse of 2008-09," presented at the International Trade and Investment Program Meeting, March 25-26, 2011.

10 D. Paravisini, V. Rappoport, P. Schnabl, and D. Wolfenzon, "Dissecting the Effect of Credit Supply on Trade: Evidence from Matched Credit-Export Data," NBER Working Paper No. 16975, April 2011.

11J. Eaton, S. Kortum, B. Neiman, and J. Romalis, "Trade and the Global Recession," NBER Working Paper No. 16666, January 2011.


Monday, May 23, 2011

Finance-Trade-Growth nexus


We study linkages between financial development, international trade, and long-run growth using data since 1880 for seventeen now-developed “Atlantic” economies and a set of cross-country and dynamic panel data models. We find that finance and trade reinforced each other before 1930, but that these effects did not persist after the Second World War. Financial development has positive effects on growth throughout the sample period, while trade affects growth strongly and independently after 1945. We attribute the rising importance of trade in explaining growth to major post-World War II changes in tariffs and quantity restrictions associated with the GATT, the establishment of the European Common Market, and the gradual elimination of capital controls after 1973. The findings are robust to the use of ‘deep’ fundamentals such as legal origin and indicators of the political environment as instruments for financial development and trade. Financial development, however, is more closely linked to these fundamentals than trade.


Abstract from a paper by Bordo and Rousseau (2011). Read the full paper here.

Changes are coming to Nepal–The Youth Dividend!

[This was published in The Week, Republica National daily, May 20, 2011, p.10]


Changes are coming to Nepal

Chandan Sapkota & Rita Shrestha

The prevailing perception right now is that whatever progress we’ve achieved so far is going down the drain. Try having an engaging conversation with people gathered at teashops or in restaurants. Most harbor pessimistic views of the country. Resigned remark such as “Kehi hunewala chhaina, dubayo desh neta harule” (Nothing is going to happen, the leaders have ruined the country) is deeply entrenched in the minds of the public.

As youth experiencing the undercurrents of hope and changes sweeping the society and economy, we’ll part away from the pessimistic views and argue that positive changes are happening, albeit gradually. The agents of change are the enterprising youth (for our case, consider the age group 15-34) who have pretty much lost faith in their political leaders.

This band of enterprising and energetic population is realizing that it’s in their hands to constructively bring about a positive change of hope in the society and dispel the fear that nothing is happening. Change and progress are happening by not talking only, but by putting ideas into action and showing best practices in a range of activities and vocations.

They are seeing hope amidst chaos and opportunities amidst challenges. The only constraint that’s slowing down this progressive change is the regressive ideas and actions of the selfish political leaders.

Changing landscapes

In August 2010, a group of energetic youth organized BarCamp Kathmandu, an ad hoc and informal gathering where youth discussed a range of issues pertinent to Nepal’s growth, innovation and development. Connecting with interested youth via Facebook and Twitter, the organizers were able to bring together over 600 participants of various age and nationalities. The networking, discussions, and outcome of the ad hoc gathering were more revealing, enchanting and inspiring than the finest and most productive day at the Constituent Assembly (CA).

“The CA Members should come and see firsthand how to make discussions productive, civilized and engaging,” remarked Shankar Pokharel, one of the organizers of the event, during tea break. The reaction from other youth was that the leaders will be humiliated to see how smoothly this kind of large yet ad hoc event runs without any drama. This is an example of how youth are constructively shaping socio-political-economy debates.

Take another example of a youth who is working on to provide drinking water in remote places cursed by altitude and dryness. Nirmal Adhikari and his associates at Kanchan Nepal—an organization based in Pokhara that focuses on water management in rural areas—visit remote places such as Doti, Dailekh and Jajarkot, study water availability, document lifestyle and help households install rainwater-harvesting tanks. Sharing a picture of such a tank on Flickr, he commented, “Apart from saving time and resources devoted to fetch water everyday, people are also using the conserved water to grow vegetables in places where you might just think it was impossible before the installation of the tank. Furthermore, it’s having an impact on household education and health standards.” Adhikari is making an impact by doing what he wanted to, not just pessimistically talk about the gloomy economic scenario of the country. This is an example of how youth are constructively engaged in development activities and making real impacts.

After completing undergraduate degree in the US, Vidhan Rana returned home with a market research outsourcing project that involves creating and maintaining client database for various state and local government agencies in the US. He has not only opened an office in Bag Bazaar and expanded his team, but is also hosting space for a local NGO, also run by youth, that is constructing schools and providing training to teachers and educational materials to schools it works with in remote areas. Rather than incessantly ranting about underdevelopment and directionless economy, youth like Rana are doing their part to ensure a direction for the services industry and making an impact by providing access to education for the disadvantaged and marginalized ones. Unlike “youth traders,”, i.e., those who make easy money by importing goods and selling them with a hefty margin without adding any value to the productive capacity of the nation, youth like Rana are the real entrepreneurs who are not only creating a foundation for future economic growth but are also giving others an opportunity to realize their potentials.

Similarly, enterprising citizens who have knowledge, experience and expertise about entrepreneurship have founded Entrepreneurs for Nepal (E4N) to encourage youth to become agents of change and real entrepreneurs. A group of conscious youth is leading a campaign against bandas. Another group of youth is engaged in cleaning public parks and airports during weekends. Even more are trying to mobilize citizens, via personal and social networking sites, to hold their elected representatives accountable.

These are some of the examples of how youth are voluntarily becoming agents of change because they have lost faith in political leadership and believe that change should come from within. These smart youth are slowly rising up in political sphere, banking sector, I/NGOs, intellectual circles, policymaking, and so forth. They are gradually changing the socio-political and economic landscapes.

Changing demographics

By the end of this decade, the number of people in the age range 15 to 34 is expected to be about 14 million, which is approximately 40 % of the estimated total population in 2020.

The number of people in the age group 15-24 will peak in 2017 and the 15-34 segments will peak in 2023. They will be the agents of change and a catalyst to the engine of growth.

Source: Computed from US Census Bureau’s population projection

With a sizable young population and low dependency ratio, the consumer market will see a huge rise in expenditure. Nepal will be one of the countries dubbed as “Young Asia” with low dependency ratio by 2050. Properly managing and encouraging the sheer number of people in this age group to constructively engage in socio-economic, development, and political activities will be of immense importance for the future of Nepal. They not only need predictable and bankable policy and political environment, but also jobs in virtually all sectors.

Hence, achieving high economic growth rate is necessary to accommodate the already enterprising youth as well as those who have zeal but lost faith in the economy. Returns to investment in this age group are enormous. Instituting an appropriate structure and policy to give direction, opportunities and jobs to the growing number of youth will be one of the most pressing economic challenges in the next few years. Else, we’ll see more migration of thousands of youth to the Gulf and other employment destinations in Asia and North Africa.

Changing challenges

The economic and political challenges faced by our nation are changing rapidly. On the economic front, our per capita income is increasing at a very slow pace and economic growth has been below 5% for years now. Compare this with the strides in growth rate and per capita income of not just India and China, but also Bhutan: they are galloping but we’re treading at snail’s pace and that too with great resistance. Meanwhile, the biggest macroeconomic challenges in the coming decade will be to rectify our trade deficit (i.e. bringing down exports to imports ratio of 1:6 to about even-even), accelerate economic growth, bring about structural transformation by reducing the number of people engaged in agriculture and finding them gainful employment in non-agriculture sector, relax the most binding constraints to economic activity (infrastructures and governance), tame surging prices of food, fuel and commodities, and provide safety nets to the most vulnerable population. With the existing pace of reform, it’s impossible to tackle these myriad of challenges. Its course has to change and it can’t be initiated by the existing political leadership who are in their 50s or more. It requires new energy, new people, new vision and enterprising youth that are less selfish than the existing leaders.

On the political front, the dynamics is changing so rapidly that it’s even hard for political analysts to correctly fathom the trend and where it’s heading to. Perhaps one reason for this is that the political rhetoric and superficial commitments of our politicians have no consistent logic as they change statements and commitments like anything. This is leading to disequilibrium in politics, policy, commitment and action. For instance, consider the commitments made by our leaders to bring out a Constitution within two years, integrate the PLA fighter within months, stimulate double-digit economic growth rate in a few years, produce 20,000MW of electricity in two decades, and not to impose bandas in 2011. All of these commitments are unfulfilled and repeatedly rebuffed by the same leaders who committed themselves to these pledges on paper.

Unchanging constraints

While youth are exploring opportunities amidst challenges in their own pace, it’s the responsibility of the state to further accelerate the novel exploration so that innovation and structural transformation occur at a speedy rate and sustainable fashion. Unfortunately, the biggest constraint to this change for the better is our political leadership, which has already shown its party-centered selfish, myopic, opportunistic and at times oppressive facades. They are not only ignoring but also undermining the changes happening in the country. Worse, they are averse to youth’ new ideas and demand for accountability and results. To counter this, even more conscious youth are needed in the political sphere.

Changing from within

Having that said, let us be mindful of the fact, however, that not all youth –such as the indoctrinated party cadres and illiterate and misguided ones – are acknowledging this change and the need to change from within. But it’s the duty of those who’ve realized this to ensure that those who haven’t realized are made aware by instituting best practices.

With all the undercurrents of change sweeping, albeit slowly, among the young generation, the country’s economic and development scenario isn’t as gloomy as is perceived by those who have lost faith in the political system. Change is coming to Nepal and is led by the young generation. The only unchanging constraint is the political leadership.


[Published in The Week, Republica National Daily, May 20, 2011, p.10]

Sunday, May 22, 2011

Food crisis: Simulation versus self-reporting

Derek Headey doubts the existing literature and analysis on food crisis and argues that the negative impacts of higher food prices in 2007-08 was more-than-compensated by economic growth (and insufficient coverage of China and India), something the existing models don’t take into account. Here is a paper (Was the global food crisis really a crisis?) by Headey.

Heady shows that global self-reported food insecurity fell during 2005 and 2008, with 60 million to 250 million fewer food-insecure people. The main reasons for this are rapid economic growth and very limited food price inflation in the world’s most populous countries, particularly China and India. Hence, he argues that food insecurity outcome shown by simulations do not match up with self-reported food insecurity level by countries. So, if the existing estimates are incorrect, then are the policy interventions designed to counter food insecurity misplaced?

Estimates of global trends in self-reported food insecurity, 2005/06 to 2007/08 (million)
Estimation scenarios Estimated change
Raw results, 70 countries -408
Raw results, 70 countries, plus assumptions for 16 omissions -326
Raw results, 68 countries, after excluding China and India 9
Raw results, 69 countries, after excluding China -132
Raw results, China and India trends adjusted by error margins -250
Raw results, China and India reductions=3 percentage points -63
Predicted change with econometric model, 88 countries -87

Source: Headey (2011) estimates from Gallup World Poll data.


In a new IFPRI discussion paper I show that these simulations suffer from serious flaws, and that their results are largely contradicted by self-reported food insecurity trends from the Gallup World Poll. The poverty simulations are often quite nice studies, but they are partial equilibrium studies with no wage adjustments, no changes in other commodity prices (like fuel, cotton, coffee, minerals), and no changes in incomes (which were growing all around the developing world from 2000-2008). Hunger simulations have more fundamental problems. Basically they count calorie availability, but the problem with a food or a financial crisis is that it is an access shock, not a production shock. Hence the FAO had to rely on a USDA model (which included reduced "calorie imports") to provide estimates of changes in hunger during the crisis. Yet in my paper I show that USDA's estimates of calorie availability (from early 2008) seem to be contradicted by USDA's own historical data on cereal availability.


[Note that self-reported food insecurity varies from country to country: in Colombia it is 67 percent, but in Nepal it is just 9 percent. The figures discussed here are global level data, not country-specific.]

Friday, May 20, 2011

Impact of climate change on food prices

Duncan Green cites a new paper that shows that changes to the climate (higher temperatures, changed rainfall, increased CO2 concentration) has meant:

  • global food prices have risen by 6.4%
  • the world has spent an additional $50bn per year on food
  • crops equivalent to one year’s production of maize in Mexico and wheat in France have been lost

Here is the abstract from David Lobell and Wolfram Schlenker’s (2011) paper:


Efforts to anticipate how climate change will affect future food availability can benefit from understanding the impacts of changes to date. Here we show that in the cropping regions and growing seasons of most countries, with the important exception of the United States, temperature trends for 1980-2008 exceeded one standard deviation of historic year-to-year variability. Models that link yields of the four largest commodity crops to weather indicate that global maize and wheat production declined by 3.8% and 5.5%, respectively, compared to a counter-factual without climate trends. For soybeans and rice, winners and losers largely balanced out. Climate trends were large enough in some countries to offset a significant portion of the increases in average yields 16 that arose from technology, CO2 fertilization, and other factors.


Green adds:


These may seem like relatively small numbers so far, but the key driver identified in the study – temperature rises – is projected to increase at significantly faster rates in the coming decades than occurred in the period of this study (global average temperatures have risen by 0.13C per decade since 1950, and are projected to rise by 0.2C per decade over next 2-3 decades, according to IPCC, with higher rises likely in areas of cultivated land – so local impacts in food growing areas will be more extreme, even assuming that there are no tipping points along the way).


Thursday, May 19, 2011

NREGA wages first converging and then diverging

Full story here. The tussle between center government and state government might affect the performance of one of the most extensive and successful (so far) safety net interventions.  More about NREGA here. In short, the program offers 100 days of guaranteed employment per annum to at least one member of rural household; unemployment benefits are given if the state fails to provide jobs within 15 days of work demanded by workers; and wage is equal to minimum unskilled agricultural wage.

Wednesday, May 18, 2011

Fight of the Century: Keynes vs. Hayek Round II

Very interesting. This is Round II.

Here is Round I.

Inefficient SOEs of Nepal: The triumph of politics over economic imperatives

This article is a product of the productive usage of the banda last Friday organized by Nepal Federation of Indigenous Nationalities (NEFIN)! It is about the sorry state of three major inefficient state-owned enterprises (SOEs) of Nepal: Electricity Authority (NEA), Nepal Oil Corporation (NOC), and Nepal Airlines Corporation (NAC). The very presence and operation style of these SOEs is distorting market prices and incentives. Their condition shows the triumph of politics over economic imperatives in the public sector in Nepal. For specific sources for stats in this article, see this earlier blog post.


Inefficient SOEs

The existing product market scenario is frustrating for consumers. A majority of the people cannot get petroleum fuel even if they are willing to pay higher prices. They cannot get enough electricity despite being willing to pay more to get extra power to light up their bulbs, and cooking and cooling devices. Furthermore, even after paying nominal charge they are still seeing dry taps in their houses. Also, those willing to fly on the national carrier are not being able to do so because of the failure of Nepal Airlines Corporation (NAC) to correctly fathom the evolving airline market.

These are some of the examples of the consequences of letting inefficient state-owned enterprises (SOEs) to either fully or partially control markets on which consumers heavily bank on to meet their daily needs. Out of a total of 36 SOEs, 18 are operating in loss and even more have negative net worth. The government’s loan investment in SOEs is over Rs 80 billion annually.

Instead of resuscitating these SOEs each time they run in fiscal trouble, squandering taxpayer’s money at the cost of development activities in rural areas and services delivery in urban areas, the optimal solution would be to either purge or reform or privatize most of the loss-making SOEs that are not strategically linked to vital security and national interests. The reason why most of these SOEs are surviving is not related to economics, but vested political interests.

Let me discuss the state of three major inefficient SOEs—Nepal Electricity Authority (NEA), Nepal Oil Corporation (NOC), and NAC—that are draining state resources each year without adding much value to productive capacity of the nation. Subsidizing and keeping these mammoth SOEs alive means that our fiscal deficit, which is 3.9 percent of GDP, will further widen and budget for a number of hospitals, schools, rural roads, and food and agriculture aid curtailed. A complete structural reform—with regards to market, price, management and operation—is essential to ensure that taxpayer’s money is efficiently utilized and that these enterprises delivery what they are supposed to.

The NEA was earning profit until FY 2058/59, but is incurring loss of about Rs 19.47 billion, which is several times more than its total assets, for a decade now. It is unable to supply electricity as per market demand. During FY 2009/10 the annual peak demand reached 885.28 MW, a 8.96 percent growth over the peak demand a year ago. Of this around 30 percent was managed by load-shedding and import from India. It is expected that total electricity demand will be around 1,400 MW by 2015. With the existing pace of power generation, it is virtually impossible to keep up with the growth in demand. The market situation is so pathetic that despite being naturally endowed with rivers having potential to power the entire country and even to supply surplus to India, we are compelled to import, at a high rate, approximately 15 percent of the existing electricity supply from India.

The state of NOC is even miserable. It is running a deficit of Rs 15 billion and monthly loss of about Rs 2 billion. Its creditworthiness is so bad that none of the financial institution is willing to lend money against any guarantee to settle outstanding debt owed to Indian Oil Corporation and to procure more fuel to satisfy increasing demand in the market.

Recently, it was reported that the government had to implore Employment Provident Fund to lend Rs 2 billion and request India to give Rs 3 billion line of credit to resolve fuel shortage for two months. This comes on top of approximately Rs 1.5 billion already given to NOC by diverting funds from a rural roads development project. The market is so distorted that even when people are willing to pay high prices they are not getting fuel as demanded. Already a liter of petrol costs over Rs 125 in the black market.

The state of NAC is heartbreaking. It is supposed to be a pride of Nepal, ferry domestic and international travelers on aircrafts with the iconic Nepali flag, and assist Nepal to achieve its tourism potential. Unfortunately, it is deeply embroiled in repeated scandals related to financial theft during purchase of badly needed aircrafts, appointment of staff, repayment of loans and so forth. It has become a hiring bank for supporters of major political parties. Its total asset is worth Rs 16.80 billion, but losses are over Rs 2 billion. It has just two big aircraft and three small aircraft. Note that at one time the NAC had 21 aircraft, including eight Twin Otters, two Boeing 727s and two 757s, and was one of the biggest foreign currency earners. With mounting losses, mismanagement, and competition from private players, NAC has lost its relevance.

A noticeable question is: How come the SOEs having a healthy balance sheet a decade ago go bankrupt and lose creditworthiness? It is because of myopic financial and operations management, poor governance and accountability, and most importantly the triumph of politics over economic imperatives. The fragile financial health of SOEs and their inability to efficiently and sufficiently satisfy market demand is a recurrent problem that cannot be resolved by applying band aid (such as providing loan sufficient to resuscitate them for few months). It requires sweeping structural changes, which may involve making painful decision of firing redundant politically-appointed staff and adjusting prices upward to reflect changing market dynamics and investment costs.

Unfortunately, this has not happened yet. The NOC is not allowed to adjust market prices. As of last week, it was incurring loss (per liter) of Rs 8.10 in petrol, Rs 23.42 in diesel, Rs 13.61 in kerosene, and Rs 322.6 in a cylinder of LPG gas. Its monthly loss is over Rs 1.96 billion. Similarly, NEA is not allowed to adjust market prices depending on market dynamics and investment costs. At present, per unit investment is Rs 8.97, but power is sold at Rs 6.57 per unit (a loss of Rs 2.40 per unit). Its total annual income is about Rs 1.5 billion but yearly operating expense is Rs 1.65 billion.

The country cannot afford to repeatedly bail out SOEs by slashing development expenditures. Worse, most of the subsidies meant for the poor are captured by the well-offs in urban centers. Effective market and product differentiation is one aspect of goods and services delivery to the targeted group. But, there is no simple fix to the inefficiencies of SOEs except for increasing ownership by management and exposing them to competitive market forces. The consumers should be the king, not the political leaders who dictate the SOE’s board to play to its pricing tunes, whose pitch depends on mood of party cadres.

Apart from stopping leakages and ensuring efficiency, allowing these institutions to adjust prices is one option in the short run to restructure their financial position, and facilitate adequate and timely delivery of goods and services. In the long run, political meddling in all SOEs should cease. They should be allowed to operate freely and competitively. If some of them fail to perform then we should let them exit the market. Meanwhile, NOC and NEA should be broken up into independent units responsible for procurement, production, distribution and retailing. It would help facilitate the entry of private players as well. They should not hold monopoly (market characterized by one seller, many buyers) and monopsony (market characterized by one buyer, many sellers) powers.

That said, subsidizing some SOEs that are vital to maintaining national and security interests are justifiable. But, NEA, NOC and NAC do not fall in this category. The more we bail them out of their financial mess and let politics overcome economics, the more inefficient will be our economic and public goods delivery systems.


[Published in Republica, May 16, 2011, p.7]

Sunday, May 15, 2011

Per capita GDP and dependent population in 2050 in South Asia

In a new ADB report (Asia 2050—Realizing the Asian Century), Nepal’s per capita GDP (PPP) in 2050 is estimated to be US$3400 and 65 plus population is expected to be 10.6 percent of the total population in 2050. See the table below for corresponding figures of other South Asian countries.

South Asian per capita GDP and 65+ population in 2050
Country per capita GDP (PPP, US$) 65+ population
Bhutan 48,600 15
India 41,700 13.7
Sri Lanka 34,700 21.4
Bangladesh 14,200 14.9
Pakistan 7,900 10
Nepal 3,400 10.6
Afghanistan 2,800 3.6

Nepal is one of the “Young Asia” that will have a large working age population compared to other nations in 2050, thus increasing potential for reaping demographic dividends. One of the lowest per capita income and one of the highest number of working age population would mean that it will have potentially cheaper factors of production. It indicates a good reason for investors to plan their investment strategy of investing in Nepal and other young South Asian nations accordingly. Additionally, Nepal’s geopolitical location (between China and India) will be attractive as well because as these nations become richer, wages will increase and markets will expand. Nepal will become the perfect location to manufacture and provide services to the Indian and Chinese population.

Wednesday, May 11, 2011

Land grabs in Africa

An interesting article about land grabs in The Economist:


Land grabs have been strikingly popular. Preliminary research by the International Land Coalition, a non-governmental organisation, reckons almost 80m hectares have been subject to some sort of negotiation with a foreign investor, more than half in Africa (see chart). This estimate is far higher than a previous one, by the World Bank, which last year said that foreign investors had expressed interest in 57m hectares. It is higher still than one by the International Food Policy Research Institute (IFPRI) which put the figure in a 2009 study at 15m-20m hectares. It would be wrong to draw a line between these numbers so as to conclude that land deals have grown fourfold. Since most are secret, knowing what to count is difficult, and the figures refer to different periods.


Note that when land deals are initially proposed four main benefit0s are offered to the host countries (apart from the benefits to the deal seeker): more jobs, new technology, better infrastructure and extra tax revenues. None of these promises seems to have been fulfilled according to the article.


So why are land deals popular? That is surprisingly easy to answer: strong demand and willing suppliers. The big investors tend to be capital-exporting countries with large worries about feeding their own people. Their confidence in world markets has been shaken by two food-price spikes in four years. So they have sought to guarantee food supplies by buying farmland abroad. China is by far the largest investor, buying or leasing twice as much as anyone else.


Here is info about conference related to land grabbing and related papers.

Growth bottlenecks: India vs. China


Although it had a lower income level than India in 1980, China's 2006 per capita gross domestic product stands more than twice that of India's. This paper investigates the role of the business environment in explaining China's productivity advantage using recent firm-level survey data. The analysis finds that China has better infrastructure, more skilled workers, and more labor-hiring flexibility than India, but a worse access to finance and higher regulatory burden. Infrastructure appears to be a key constraint for India: it lags significantly behind China, yet it has important indirect effects for the effectiveness of labor flexibility. Labor flexibility is also likely a major constraint for India, as evident in the predominance of small firms, the importance of firm size in accounting for India's disadvantage in productivity, and the complementarity of proxies of labor flexibility with infrastructure and access to finance. Interestingly, regulatory uncertainty has adverse effects in India but not in China. The empirical analysis suggests that it is important to consider country-specific growth bottlenecks and the indirect effects of policy reforms.


Full paper by Li, Mengistae and Xu (2011).

Friday, May 6, 2011

South-South aid to Nepal

The share of South-South aid (i.e. aid flow between developing countries) in total ODA committed to Nepal is increasing. Total ODA amounted to around US$1 billion in 2009.  Most of the ODA Nepal receives is from Northern donors. The five Southern donors are China, India, OPEC Fund, Saudi Development Fund, and Kuwait. India is by far the largest Southern donor (over 67 percent of total South-South aid commitment). Overall, it contributes about 10 percent of the total ODA received by Nepal. [India is allowed to directly spend up to NRs 50 million (around 0.7 million USD) in development/welfare activities without informing the Nepalese authorities.]

South-South aid commitment to Nepal (US$ million)
Fiscal year 2004/05 2005/06 2006/07 2007/08 2008/09 2009/10 2010/11
China 0.14 0.14 12.07 1.39 36.60 29.41 35.48
India 8.65 4.75 61.91 38.61 95.45 100.70 92.55
OPEC Fund 4.99 7.90 7.23 3.14 - - 8.11
Saudi Development Fund 5.30 0.89 1.25 3.06 3.45 6.01 3.57
Kuwait 3.96 0.91 - - - - -
Total 19.08 13.68 82.46 43.37 135.49 136.12 139.71
Share of South-South aid in total aid commitments (%) 4.12 2.97 14.61 6.97 14.83 12.48 11.49

The above table is adapted from Chandra Ghimire’s forthcoming paper (New Age of South-South Development Cooperation: A Case Study of Nepal). He is a joint-secretary at Ministry of Commerce & Supplies (MoCS). Exchange rate used is USD 1= NRs 72. (Note: Read Ghimire’s paper when it is publicly available. It has valuable information about South-South donors and aid received by Nepal.)

Infrastructure sector receives the biggest share of South-South aid. It received 83 percent of total South-South aid commitment over FY 2006/07-2010/11. Trade and industry, and finance and agriculture received 7 percent each. Social sector received 3 percent.


Here is excerpt from a previous blog post about foreign aid to Nepal:

Foreign Aid to Nepal (total, million, current US$)
BA & ODA 1960-2008 1992-1999 2000-2008
Net bilateral flows 7582 2002 3116
Net ODA and Official Aid received 11732 3205 4289
Net ODA per capita (current US$) 561 147 160
GDP 159823 34859 70847
Net bilateral flows (% of GDP) 4.74 5.74 4.4
Net ODA (% of GDP) 7.34 9.19 6.05

Top bilateral donors (1960-2008):

  • Japan has been the largest bilateral donor so far (1960-2008): US$ 2.06 billion
  • Followed by the UK (1960-2008): US$ 1.03 billion
  • Followed by Germany and the US (1960-2008): US$ 974 million and US$ 940 million
  • Other top donors are European nations; the Scandinavian countries are very generous
  • In this decade (2000-2008), top donors have jacked up bilateral assistance.

Average annual bilateral flows have been increasing. On average (annual), it was US$ 346 million between 2000 and 2008. The average annual net ODA flows during the same period was US$ 477 million.

Net ODA per capita (current US$) has been US$ 561 between 1960 and 2008, and US$ 147 over 1992-1999, and US$ 160 over 2000-2008.

  • Net bilateral flows between 1990 and 2008 have been 4.74 % of GDP.
  • Net bilateral flows between 2000 and 2008 have been 4.40 % of GDP.
  • Net ODA between 2000 and 2008 have been 6.05 % of GDP.


Over the period 2007-08, humanitarian aid sector received the highest amount, followed by economic infrastructure & services, health and population and so on…. It looks like the Southern donors are more interested in investing in infrastructure and productive sectors.

(Note that total ODA figure depends on which database you are looking at. But, there isn’t much variation if you just look at the shares from various sources.)

Now, the effectiveness of aid received by Nepal is another question. Here is discussion (needs update now) on the issue.