Showing posts with label FDI. Show all posts

Sunday, August 23, 2020

Impact of COVID-19 on the external sector

The IMF’s latest external sector report highlights the state current account balance amidst the global trade and supplies disruptions caused by the COVID-19 pandemic. The pandemic has sharply curtailed global trade, lowered commodity prices, and tightened external financing conditions. 

According to the report, the world had a current account surplus of about 2.9% of world GDP in 2019. About 40% of current account surpluses and deficits were excessive in 2019. Euro area had larger-than-warranted current account balances, but the US, the UK and Canada had lower-than-warranted current account balances. China’s external position remained unchanged and they were broadly in line with fundamentals and desirable policies. Currency movements were generally modest, but with preexisting vulnerabilities/fundamentals in EMDEs (large current account deficits, a high share of foreign currency debt, and limited international reserves or reserves adequacy). 


The IMF forecasts current account surplus narrowing by 0.3% of world GDP in 2020, thanks to large fiscal expansion but offsetting increases in private savings and lower investment (precautionary move by household and business sectors). Economies dependent on severely affected sectors such as oil and tourism, and remittances have been hit hard.  There was a sudden capital flow reversal and currency depreciations in EMDEs as financial market sentiment deteriorated during the initial days of the crisis. Unsurprisingly, global reserve currencies appreciated as investors looked for safe haven amidst the financial stress. There is some unwinding now though, reflecting exceptional monetary and fiscal policy support. 

Current account balances in 2020 will be affected by 

  • Contraction in economic activity (lower output/export and import demand)
  • Tightening in global financial conditions
  • Lower commodity prices (oil, metals, food, raw materials)
  • Contraction in tourism
  • Decline in remittances 

The number of export restrictions in 2020 is higher than during the global financial crisis, but the number of import restrictions is lower. Sectors such as pharmaceutical and medical supplies, made-up textile articles, wearing apparel, rubber products, and ethyl alcohol and spirituous beverages faced the most export restrictions.  

Some EMDEs with preexisting vulnerabilities (large current account deficits, a high share of foreign currency debt, and limited international reserves) might face high risk of an external crisis (with capital flow reversals and currency pressures) if risk sentiment deteriorates. 

A second wave of the pandemic could lead to tightening of global financial conditions, narrow the scope of EMDEs to run current account deficit, further reduce current account balances of commodity exporters, and deepen the decline in global trade. Up to now, swift response of central banks (policy rate cuts, liquidity support, asset purchase programs, and swap lines offered by the US Federal Reserve) and expansionary fiscal policy have contributed to an easing in global financial conditions. EMDEs experienced sudden capital flow reversals in late February and march but then stabilized in most cases with even modest inflows in selected economies. 

Near-term priority

The near-term priority should be to provide relief and promote economic recovery. 

  • Flexible exchange rates should be allowed to adjust as needed to absorb external shocks (especially a fall in commodity prices or tourism). 
  • Official financing to ensure continued healthcare spending is required for those economies experiencing disruptive balance of payments pressures and without access to private external financing. 
  • Tariff and non-tariff barriers to trade, especially on medical equipment and supplies, should be avoided. 
  • Countries with adequate forex reserves could engage in exchange rate intervention to avoid disorderly market conditions and limit financial stress. 
  • Countries with limited reserves and facing reversals of external financing, capital outflows management measures could be useful (but these should be used to substitute the warranted macroeconomic and structural policy actions).

Medium-term priorities

Preexisting economic and policy distortions may persist or worsen over the medium-term.

  • Fiscal consolidation over the medium term would promote debt sustainability, reduce current account gap, and facilitate raising international reserves. Note that excess current account deficits in 2019 partly reflected larger-than-desirable fiscal deficits. 
  • Productivity-enhancing reforms would benefit economies with low export competitiveness. 
  • For countries with large current account surpluses after the COVID-19 pandemic, prioritizing reforms to encourage investment and discourage excessive private savings are warranted. In some instances, economies with large current account surpluses could discourage excessive precautionary savings by expanding the social safety nets. 
  • For economies with some fiscal space, emphasis on greater public sector investment would be helpful to narrow excess surpluses and to stimulate economic activities. 

Outlook for 2021

The outlook for 2021 is highly uncertain. Under a scenario where a second major global outbreak occurs in early 2021 (disruptions to economic activity is assumed to be half the size of the baseline in 2020, financing tightening of about one-half of the increase in sovereign and corporate spreads since the outbreak began in EMDEs, and relatively limited tightening of sovereign premiums for advanced economies),

  • Global trade is projected to decline by an addition 6%, global GDP decline by 5%, and oil prices to be higher by 12% compared to the baseline. 
  • Recovery in global trade will be underpinned by the need to rebuild the capital stock (investment goes up), and higher import intensity of exports. 
  • Emerging market economies will face higher borrowing costs, lower oil prices and subdued domestic demand – it will raise current account balances toward surplus. 
  • Net oil exporters will face lower oil prices, which will reduce their current account balances.
  • Advanced economies will face relatively limited tightening in external financing conditions and greater fiscal policy space will mean lesser import compression than among EMs, leading to lower current account balances. 
  • So, capital will flow from EMs to AEs, highlighting the unequal impact of the crisis and the need for a global policy response. 
  • Under a faster recovery scenario, global trade rises by 4% in 2021 compared to the baseline. 

The report notes that the historical relationship between trade and the components of GDP/aggregate demand (or import-intensity-adjusted measure of aggregate demand, which basically is a weighted average of aggregate demand components in which the weights are the import content of each component computed from national accounts input-output tables) fully explains the expected global decline in trade of goods. A part of the impact of lower economic activity on trade is felt through global value chains. After the global finance crisis circa 2009, residual factors such as rising protectionism explained part of the fall in trade in goods and services as they could not be fully explained by the fall in economic activity alone. Services trade contraction in 2020 is more severe than what could be expected based on the historical relationship between services trade and aggregate demand, suggesting the role of special factors such as travel restrictions. 

The IMF determines excessive current account balances by comparing the actual current account (stripped of cyclical and temporary factors) and the current account balance that is consistent with fundamentals and desirable policies. The resultant gap reflects policy distortions (e.g., higher current account balance than implied by fundamentals and desirable policies correspond to a positive current account gap, whose elimination is desirable over the medium-term). The IMF also considers REER that is normally consistent with the assessed current account gap. A positive REER implies an overvalued exchange rate. Other indicators that are considered are financial account balances, international investment position, reserve adequacy, and other competitiveness measures such as the unit-labor-cost-based REER and staff views on the current account gap using country-specific trade elasticities. 

On economic and financial fundamentals, and desired policies, advanced economies with higher incomes, older population, and lower growth prospects have positive current account norms. EMDEs tend to have negative current account norms because they are expected to import capital to invest and exploit their higher growth potential.

Thursday, August 24, 2017

Brief snapshot of Nepalese economy in FY2017

Since the full year FY2017 (mid-July 2016 to mid-July 2017) provisional data is available, except for some public finance variables, this post will try to give an overall picture of the performance of the economy. I will have a brief outlook for FY2018 in the next blog post. 

Real sector

Central Bureau of Statistics (CBS) estimated that Nepal’s economy (gross value added at basic prices) would likely grow by 6.9% in FY2017, sharply up from 0.01% in FY2016 and 3% in FY2015. It projected agricultural, industrial and services will grow by 5.3%, 10.9% and 6.9%, respectively. Base effect, favorable monsoon, improved electricity supply, normalization of supplies and tourism activities contributed to the rosy economic activities. For detailed analysis, see this.

Fiscal sector

Both recurrent and capital spending grew at a rate higher than in FY2016. Overall, expenditure grew by 46%, up from 15.3% in FY2016, led by acceleration of reconstruction works (including distribution of first and second tranche of grants) and some progress in capital spending. But, the overall pattern of spending did not change even though budget was announced one-and-a-half months prior to the start of the fiscal year. It was argued that this will give ministries adequate time to get approval for spending and initiate preparatory project planning (especially procurement documents), all of which were expected to accelerate capital spending. Specifically, the idea was to finish all preparatory work and start issuing tender notices and in some cases finalize contractors before the start of festival season (September-November). However, this was not the case. 


First, the spending pattern (i.e. quality of spending) hardly changed despite the early approval of budget. Almost 60% of the actual capital spending happened in the last quarter and 41.2% in the last month. It raises doubt over the quality of spending. Second, capital spending absorption capacity has receded. Just 65.5% of planned capital budget was spent in FY2017 (NRs204.3 billion spent vs NRs311.9 billion planned). Although it is slight higher than 58.6% in FY2016 (when the economy was crippled by trade and supplies disruptions), it is still lower than 76% in FY2015 (when earthquakes struck around the last quarter of fiscal year). As a share of GDP, capital spending increased to 7.9% of GDP, up from 5.4% of GDP. The planned capital spending in FY2017 was 12% of GDP. For more on capital spending, see this.  


In FY2017, total spending reached an estimated 27.8% of GDP (recurrent 19.9% of GDP and capital 7.9% of GDP). Total expenditure including net lending was 29.9% of GDP. Revenue mobilization was higher than targeted, thanks to the normalization of imports/supplies and pickup in economic activities. Revenue mobilization reached 23.4% of GDP (including tax revenue of 21.1% of GDP). VAT and customs tariffs contributed 26.3% and 24.3%, respectively to the overall revenue mobilized in FY2017. Foreign grants increased to 2.9% of GDP as reconstruction aid started to materialize gradually.

These together resulted in a fiscal deficit of about 3.6% of GDP. Primary deficit was 0.6% of GDP. Overall, expenditure growth was faster than revenue growth, leading to a larger fiscal and primary deficit. This is okay for now given the reconstruction and investment needs of an economy with low per capita income. However, the priority should be to enhance quantity as well as quantity of capital spending (and to rein in rising recurrent spending). Outstanding public debt stood at around 25% of GDP (figures up to Q3FY2017). For a quick review of FY2018 budget, see this.
Monetary sector

Inflation moderated substantially to 4.5% in FY2017, down from an average 9.1% over FY2010-FY2016, thanks to normalization of supplies & base effect, low inflation in India, low and stable administered fuel prices, bumper agricultural harvest due to favorable monsoon, and improved energy supply. Specifically, food inflation dropped to 1.9% from 10.9% in the previous year, and non-food inflation slumped to 6.5% from 9.2% in the same period. Prices grew at a negative rate in the case of vegetable, fish and meat, ghee and oil, transportation and communication. In fact, prices of all items in the CPI basket decreased except for sugar and sugar products. If you look at monthly inflation figures, there is a deflationary trend in the case of food and beverage prices since January 2017.


The effect of deceleration of remittance is quite visible in monetary aggregates and external sector. Money supply (M2) growth moderated to 15.5% (from 19.5% in FY2016) due to the slump in net foreign assets, which grew by just 8.6% (compared to 25.3% in FY2016). Credit to private sector decelerated but government borrowing increased. Overall, deposit growth was 14%, but credit growth was 17.8% (both are lower than in FY2016). Credit and deposit growths of development and finance companies were even negative. About 29.8% of the total increase in lending in FY2017 (NRs.304.4 billion) went to wholesalers and retailers, followed by industry, finance & insurance, services, and construction. As a share of GDP, M2, total deposit and total credit stood at 99.7%, 88.5% and 86.2% respectively in FY2017. 


The slow deposit growth (caused by deceleration of remittances and slow government spending) and little room for credit expansion by BFIs (some were hitting the capital to deposit ratio of 80) resulted in volatile interest rates. The weighted average deposit and lending rates were 4.5% and 9.9%, respectively in FY2017 (both higher than in FY2016). Similarly, interbank lending and 91-day treasury bills rate increased to 2.6% and 1.45% (again both higher than in FY2016). Rates for 14 days deposit auction and 14 days repo auction (liquidity management policy tools used by the NRB) averaged 0.25% and 4.87%, respectively. Reverse repo rate was 1.58%. 

Non-performing loans continue to decline, reaching 1.63% of total loan by mid-April 2017. Capital adequacy ratio is above the regulatory threshold (10% plus 1% buffer).

Overall, inflation is moderating, but retail interest rates are rising indicating the deficiency of liquidity management tools (liquidity was ample towards the last month of FY2017 and first quarter of FY2018).


The stock market too remained volatile with NEPSE index closing at 1582.7 at the end of FY2017, down from a high of 1818.2 in FY2016. The number of listed companies decreased to 208 from 230 in the previous year. Stock market capitalization decreased to 71.4% of GDP from 84.1% of GDP in FY2016. Stock market turnover was NRs205 billion (0.011% of market capitalization). Commercial banks had the largest share (about 46.5%) of total turnover, followed by insurance and development banks.

External sector

External sector deteriorated in FY2017. The normalization of supplies (after crippling trade embargo in FY2016) resulted in modest export growth but a large import growth. In US dollar terms, merchandise export (fob) increased by 9.8% but merchandise import (cif) increased by 29.4%, leading to increase of merchandise trade deficit by 31.6%. Meanwhile, workers’ remittances continued to decelerate (in NRs terms). While it grew by 4.6% in Nepalese rupee terms (slower than in the last three years), it grew by 4.7% in US dollar terms (slightly higher than 2.1% in FY2016). The deceleration/slow growth of remittances is due to the decrease in the number of overseas migrant workers. On an average, 1,093 migrant workers left the country daily in FY2017, down from 1,147 in FY2016, 1,405 in FY2015 and 1,446 in FY2014. Workers’ remittances was US$6.6 billion (about 26.8% of GDP).


Nepal’s export is crippled by structural bottlenecks as well as supply-side constraints, and import demand of fuel and durables/construction materials is somewhat inelastic due to the wide gap between production and demand in the economy. Meanwhile, given that remittance inflows are likely to continue to slowdown, current account may be in negative territory for the next couple of years. For more on the impact of slowdown in remittance inflows, see this.


Overall, merchandise trade deficit reached 34.5% of GDP, but net transfers (includes remittances) was just 32.8% of GDP and net services and income balance were just 1.3% of GDP, resulting in current account deficit of 0.4% of GDP. The last time Nepal had CAD was in FY2011. FDI inflows increased to US$127.5 million from US$55.8 million. Balance of payments surplus decreased to 3.2% of GDP from 8.4% of GDP in FY2016. Gross foreign exchange reserves stood at US$10.1 billion, which is enough to cover 11.4 months of import of goods and services. 


Nepalese currency appreciated by 3.8% vis-à-vis US dollar at the end of FY2017 after five years of continuous depreciation. 


In a nutshell, the Nepalese economy in FY2017 recovered fast from the slump triggered by crippling supplies disruption, political instability, lingering effects of 2015 earthquakes and slow reconstruction in FY2016. Growth was one of the highest in recent decades, but this is largely a base effect blessing. Revenue mobilization surged past the target as supplies normalized and economic activities started to pick up. Expenditure was higher, but not of expected level especially capital spending. Inflation was lower but retail interest rates are rising as deficient liquidity management took a toll on credit flows. The banking sector also contributed to this by engaging in reckless lending to a select (unproductive) sectors. External sector deteriorated with current account in the negative territory (but it was expected).

Saturday, September 26, 2015

Migration, remittances and balance of payments post April 25 earthquake in Nepal

This is adapted from Macroeconomic Update, August 2015, Vol.3, No.2 (executive summary here, and FY2016 growth and inflation outlook here). It presents is the composition of Nepal’s outstanding internal and external debt. The Macroeconomic Update includes FY2015 update on real, fiscal, monetary and external sector, and growth and inflation outlook for FY2016. It provides a comprehensive macroeconomic assessment, including fiscal sustainability, after the April 25 earthquake.


I. Remittances

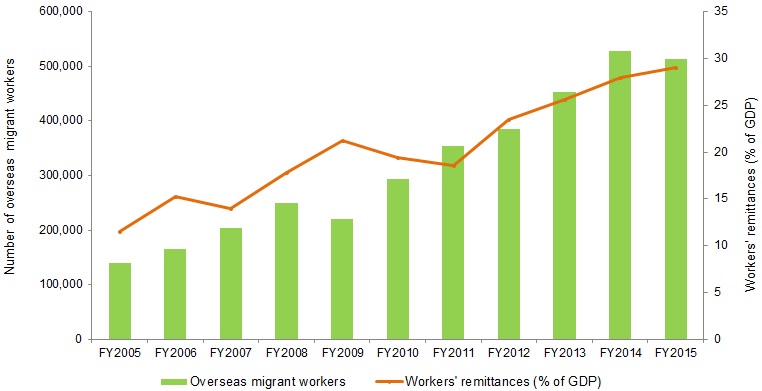
Despite the deceleration of remittance inflows till the third quarter of FY2015, the earthquake in the last quarter prompted migrant workers to drastically increase the amount of income remitted to Nepal. Consequently, workers’ remittance inflows reached a record 29.1% of GDP in FY2015, equivalent to $6.2 billion (Figure 1). In US$ terms, remittance inflows grew by 12.2%, marginally up from 11.9% growth in FY2014.[1] This follows a 16.4% growth of migrant workers (those who obtained permits form the Department of Foreign Employment).

Figure 1: Number of migrants and remittance inflows

II. Migration

According to the Department of Foreign Employment, growth of migrant workers decreased by 2.8% (Table 1) against a growth of 16.4% in FY2014 as recruitment process got derailed for over a month and potential migrant workers deferred travel plans in view of the immediate relief and temporary reconstruction works needed in the earthquake affected areas. A total of 512, 887 migrants legally left to work overseas in FY2015 (daily average of 1,405), down from 527,814 in FY2014 (daily average of 1,466). Malaysia, Qatar, Saudi Arabia, and UAE have remained the top employment destinations for low and semi-skilled Nepalese migrant workers (Figure 2). They together accounted for 92% of total migrant workers in FY2015. As a share of total migrants, Malaysia’s share increased from 34.6% in FY2013 to 40.6% in FY2014, but declined to 39.5% in FY2015. Meanwhile, Qatar’s share also decreased from 24.4% in FY2014 to 24.2% in FY2015. Saudi Arabia, Japan and South Korea absorbed higher share of migrant workers when compared to the shares in FY2014.

Figure 2: Destination-wise distribution of labor migrants

Table 1: Monthly out-migration

Number of migrants Y-o-Y growth
mid-month FY2014 FY2015 FY2014 FY2015
August     45,519     42,309 39.3 -7.1
September     24,214     51,551 -13.8 112.9
October     31,959     35,550 -15.9 11.2
November     31,949     43,213 24.7 35.3
December     41,634     53,354 19.1 28.2
January     50,032     45,362 22.4 -9.3
February     37,285     48,941 -0.5 31.3
March     48,552     44,460 24.2 -8.4
April     45,854     52,210 10.1 13.9
May     54,173     31,375 37.9 -42.1
June     54,926     37,962 21.0 -30.9
July     61,717     26,600 22.3 -56.9
Total   527,814  512,887 16.4 -2.8

III. Balance of payments

Despite the weak currency, which improved relative price competitiveness, exports failed to pick up in the first three quarters and then plunged drastically as production got severely affected by the April earthquake and its aftershocks. Merchandise exports (free on board [fob]), in US dollar terms, decreased by 3.9%-- a sharp fall from 5.1% growth in FY2014. The country exported merchandise goods worth $990.8 million, down from $1.03 billion in FY2014. Overall, merchandise exports decreased to 4.6% of GDP in FY2015 from 5.2% of GDP in FY2014. Exports to India, the People’s Republic of China (PRC), and other countries accounted for 65.5%, 2.6% and 31.9%, respectively, of total exports in FY2015.

Merchandise imports growth (cost, insurance freight [cif]) in dollar terms slowed down to 8.0% from 13.9% growth in FY2014 as it got hit due to the severe disruption in economic activities and a slump in import demand following the earthquake. Of the total imports of $7.6 billion, 14.7% was oil imports. In US dollar terms, this is equivalent to $1.1 billion, higher than the value of the country’s total merchandise exports but lower than the oil import bill in FY2014. This is primarily due to the low international oil prices and the weakening of aggregate demand in the last quarter of FY2015. Overall, merchandise imports stayed unchanged at 35.9% of GDP in FY2015 and FY2014. Imports from India, PRC, and other countries accounted for 63.5%, 12.9% and 23.6%, respectively, of total imports in FY2015.

Figure 3: Balance of payments (% of GDP)

The country’s external situation strengthened in FY2015 with the balance of payment surplus reaching $1.5 billion (6.8% of GDP). Though this is an impressive increase from the $1.3 billion (6.5% of GDP) surplus in FY2014, it is still lower than the $1.6 billion (8.2% of GDP) surplus in FY2012 (Figure 3). The large merchandise trade deficit, which reached 31.2% of GDP, was partially[2] offset by workers’ remittances, which reached a record 29.1% of GDP, and export (4.6% of GDP), resulting in a current account surplus of $1.1 billion (5.1% of GDP), up from 4.6% of GDP in FY2014. While capital transfers decreased by 14.3%, financial transfers increased by 57.0% as a result of the 35.5% jump in foreign direct investment, amounted to $44.2 million. Gross foreign exchange reserves increased from $6.8 billion in FY2014 to $8.3 billion FY2014, sufficient to cover 11.2 months of imports of goods and non-factor services.


[1] In local currency, the growth rate was 13.6% in FY2015, down 25.0% growth in FY2014.

[1] Overall, the net goods, services and income balance was a negative 28.3% of GDP, which was offset by net transfers equivalent to 33.4% of GDP, resulting in current account surplus equivalent to 5.1% of GDP.

Wednesday, September 10, 2014

Nepalese economy in FY2014: Real sector

This blog post is adapted from Macroeconomic Update, August 2014, Vol.2, No.2. Here is an earlier blog post on FY2015 GDP growth and inflation forecasts.


Gross domestic product (GDP) grew by an estimated 5.2% in FY2014, up from 3.5% in FY2013, as a result of the bumper agricultural harvest, moderate recovery in construction, and robust services activities backed by high remittance income (Figure 1). The services sector contributed about six-tenths of the GDP growth, largely coming from wholesale and retail trade; and transport, storage and communication activities. The agriculture sector’s contribution to the GDP growth stood at three-tenths and the industry sector contributed about one-tenth.

In the agriculture sector, which comprises almost 35% of GDP and provides livelihood to about 76% of households, growth rebounded to an estimated 4.7%, the highest in the last six years. The timely and favorable rainfall, and the adequate supply of agricultural inputs, including chemical fertilizers, boosted production of both summer and winter crops.[2] According to the Ministry of Agriculture Development, paddy production is projected to increase by 12%, up from a 11.2% decrease in FY2013. Similarly, maize production is estimated to increase by 9.9%, up from an 8.3% decrease in FY2013. Wheat production is projected to increase by 6.1%, up from 2.0% in FY2013. Paddy, maize and wheat accounted for 52.5%, 23.3% and 20.1%, respectively, of total cereal production in FY2013 (Figure 2).

The industry sector, which comprises a mere 15% of GDP, grew by an estimated 2.7%, marginally up from its 2.5% growth rate in FY2013, as construction, and electricity, gas and water grew modestly despite a slowdown in manufacturing. The timely budget and modest acceleration in actual capital expenditure (though still low compared to the planned expenditure) propelled construction activities growth to 2.9%, up from 1.9% in FY2013. Manufacturing activities grew by 1.9%, the lowest rate in the last five years, primarily due to the impact of long hours of power cuts, persistent supply-side constraints, and the rise in cost of production due to the increased prices of imported raw materials. Concrete, sugar, aluminum materials, vanaspati ghee, paper, biscuits and beer production fell by over 30% in the first two quarters of FY2014. The average capacity utilization of key industries remained at 49.9% in the first half of FY2014, slightly higher than the 44.7% capacity utilization recorded in the first half of FY2013.[3]

The remittance-induced consumption demand propelled services sector growth to an estimated 6.1%, the highest growth rate in the last six years. The services sector, which comprises about 51% of GDP, grew by 5.2% in FY2013. Within the services sector, wholesale and retail trade— whose share in GDP was 14.9% in FY2014, higher than the share of the industry sector— grew by an estimated 8.8%, two percentage points higher than in FY2013 (Table 1). Wholesale and retail trade’s contribution to GDP stood at 1.32% in FY2014, up from 0.98% in FY2013, reflecting the strong growth of remittance inflows, which boosted consumption demand of imported goods. The increase in the number of tourist arrivals and its positive impact on spending boosted hotel and restaurant activities by an estimated 7.1%, up from 5.5% in FY2013. Driven largely by the robust increase in communication related activities, the transport, storage and communication sub-sector grew by 7.5%, marginally up from 7.4% growth in FY013. The slow recovery of real estate, renting and business sub-sector, which grew by 3.0% from 2.7% in FY2013, reflected the tight sectoral credit policy imposed by the central bank on banks and financial institutions.[4]

Table 1: Sub-sectoral growth and share of GDP

  Growth Share of GDP
Sub-sector FY2013R FY2014P FY2013R FY2014P
Agriculture and forestry 1.1 4.7 33.5 32.6
Fishing 2.7 4.9 0.4 0.5
Mining and quarrying 3.3 3.7 0.6 0.6
Electricity, gas and water 0.3 4.8 1.3 1.2
Manufacturing 3.7 1.9 6.4 6.1
Construction 1.9 2.9 6.9 6.8
Wholesale and retail trade 6.8 8.8 14.5 14.9
Hotels and restaurants 5.5 7.1 1.9 2.0
Transport, storage and communications 7.4 7.5 8.9 8.7
Financial intermediation -0.9 1.8 3.9 3.8
Real estate, renting and business activities 2.7 3.0 8.8 8.4
Public administration and defense 5.5 5.7 2.0 2.4
Education 5.9 6.0 5.8 6.4
Health and social work 5.6 5.5 1.4 1.5
Community, social and personal services 4.6 4.7 3.7 4.1

Source: Central Bureau of Statistics

On the expenditure side[5], consumption accounted for an estimated 91.1% of GDP, up from 89.9% of GDP in FY2013 (Figure 3), indicating the increasing consumption demand stimulated by growing remittance income.[6] Gross capital formation stood at an estimated 37.1% of GDP, contributed mostly by the increase in gross fixed capital formation (GFCF) from 22.6% of GDP in FY2013 to 23.1% of GDP in FY2014 despite a decrease in stocks from 14.3% of GDP in FY2013 to 13.9% of GDP in FY2014. Public and private GFCF were an estimated 4.7% and 18.5% of GDP, respectively. Despite these high investment figures, the impact on growth and employment is pretty nominal, most probably due to the inefficiency of investment management arising from the lack of efficiency-enhancing prerequisites related to physical and social infrastructures, and the inability to unwind expenditures in underperforming and unfeasible projects.

Despite an increase in exports, the high import demand— backed by high remittance income in the absence of domestically produced alternatives—further widened net exports, reaching an estimated negative 28.2% of GDP in FY2014 from 26.8% of GDP in FY2013. The increase in price competitiveness as a result of the weak currency pushed exports of goods and non-factor services to an estimated 12.1% of GDP, up from 10.7% of GDP in FY2013. Meanwhile, imports of goods and non-factor services increased to 40.3% of GDP in FY2014 from 37.5% of GDP in FY2013. The major factors affecting supply capacity and cost competitiveness of exports sectors are: (i) lack of adequate and quality infrastructure; (ii) political instability and strikes; (iii) recurring labor disputes and low productivity; (iv) lack of skilled human resources; (v) deficient research and development investment and innovation in the private sector; and (vi) policy inconsistencies and implementation paralysis.[7]

Gross domestic savings declined to an estimated 8.9% of GDP from 10.1% of GDP in FY2013 and 14% of GDP in FY2011. It indicates that a majority of the residents’ income is spent on consumption, which is mostly fulfilled by imported goods. Meanwhile, the substantial increase in gross national savings— from 40.3% of GDP in FY2013 to an estimated 46.4% of GDP in FY2014— reflects the record high remittance inflows, which reached 28.2% of GDP in FY2014. It has also contributed to a positive savings-investment gap[8] (an estimated 9.4% of GDP in FY2014) in the last three consecutive years. Though per captia GDP increased to an estimated $713.8[9] in FY2014 from $709.5 in FY2013, it is still lower than $715.8 in FY2012 (Figure 4). The fluctuation in per capita GDP is partly attributed to the depreciation of Nepalese rupee against the US dollar. Reflecting the high per capita remittance inflows, nominal per capita gross national disposable income reached an estimated $981.6 from $923.7 in FY2013. Per capita GNI stood at $727.9 in FY2014. The size of Nepal’s economy expanded to an estimated $19.7 billion in FY2014, marginally up from $19.3 billion in FY2013.

Domestic investment commitment: Total domestic capital investment (fixed capital plus working capital) commitment increased remarkably by 142% in FY2014, up from a rate of 42% in FY2013. As a share of GDP, it reached 15% in FY2014, up from 5.5% in FY2012, largely due to an astounding 158% increase in investment commitment in the energy sector. Overall, of the total investment commitment of NRs289 billion in FY2014, 77.3% was in the energy sector, followed by construction (12.1%), manufacturing (6.3%), and tourism (2%) (Figure 5). As a share of GDP, investment commitment in the energy sector went up from 5.1% in FY2013 to 11.6% in FY2014, indicating the rising investor confidence emanating from the strong commitment by the new coalition government to introduce investor-friendly reforms in a range of sectors, including energy. Energy sector development is the top priority of the new government.

Foreign direct investment (FDI) commitment: FDI commitment, approved by the Department of Industry, reached NRs20.1 billion in FY2014, marginally up from NRs19.8 billion in FY2013 (Figure 6). It translates into a growth of just 1.5% compared to 115% in the previous year. Consequently, as a share of GDP, it stood at a mere 1.04%, lower than 1.2% of GDP in FY2013. That said, while the FDI commitment in manufacturing, mineral, service and tourism sectors decreased, the energy sector saw an impressive 306% growth, mostly coming from India and China—which together accounted for 91% of the total energy FDI commitment. Country-wise FDI commitment shows that the People’s Republic of China (PRC) surpassed India as the top FDI source country with a 36.4% share of total FDI commitment in FY2014. The other top FDI source countries are South Korea, Cook Islands, USA, Japan, British Virgin Islands, and Singapore— together accounting for about 20% of total FDI commitment. It may be noted that despite the increase in FDI commitment, actual FDI inflow, as per the balance of payments, significantly decreased from NRs9.1 billion in FY2013 (0.5% of GDP) to NRs3.2 billion in FY2014 (0.2% of GDP).


[1] R and P denote revised estimate and provisional estimate, respectively. Any reference to GDP for FY2013 and FY2014 in this Macroeconomic Update refers to revised and provisional estimate, respectively.

[2] Major winter crops are wheat, barley, potato, winter tomato, cauliflower and cabbage. Major summer crops are paddy, maize, millet, buckwheat and summer potato.

[3] Capacity utilization of key industries in FY2013 was 57.8%, the same as in FY2012.

[4] Responding to the busting of real estate and housing bubble, triggered by a decline in the growth of remittances in FY2011, and a build-up of non-performing loans, the central bank imposed a lending cap of 25% to this sector in FY2012. It contributed to the cooling down of prices in this sector.

[5] The GDP by expenditure data are prone to measurement errors as change in stocks is computed residually, which also includes statistical discrepancy/errors. Change in stocks was estimated to be 13.9% of GDP in FY2014. A large residual indicates that a significant portion of the GDP is either unexplained or could not be directly attributed to its components, i.e. consumption, capital formation and net exports.

[6] It may be noted that even though final consumption with respect to GDP is very high, the actual domestic consumption expenditure made up an estimated 62.9% of GDP in FY2014, down from 63.1% of GDP in FY2013 and 65.5% of GDP in FY2012. This is due to the surge in net exports (or export minus import) in FY2014, , i.e. the consumption expenditure on imports of goods and non-factor services.

[7] For more on Nepal’s export competitiveness, see the issue focus section of Macroeconomic Update, Vol.2, No.1, February 2014.

[8] Computed as the difference between gross national savings and gross capital formation.

[9] US$1=NRs98 in FY2014 and US$1=NRs87.7 in FY2013.

Tuesday, February 25, 2014

NEPAL: Recent macroeconomic analysis

[This write-up is adapted from economic analysis of ADB's Nepal Country Partnership Strategy 2013-2017.]


A. Overview

1. Despite internal and external challenges, Nepal has managed to maintain overall macroeconomic stability through prudent fiscal and monetary policies. The average gross domestic product (GDP) growth rate during the fiscal year (FY) 2007–FY2013 period since the end of its civil conflict has been 4.4%, compared with an average 3.8% during  the conflict (FY1996–FY2006). Growth has been largely driven by agriculture and services and has been sluggish in the industrial sector. Growing remittance income and tourism receipts have been crucial in maintaining balance of payments stability despite a widening trade deficit. Even with rising recurrent expenditures, the fiscal deficit has remained below 2.2% of GDP, due mainly to rapid growth in revenue mobilization, but also to low capital expenditure. On the social development front, remarkable progress has been made in reducing absolute poverty, and the country is on track to achieve a majority of the Millennium Development Goal (MDG) targets. A resolution of pressing challenges—an ongoing political transition and structural bottlenecks in particular—combined with reforms to improve the investment climate and the continued growth of internal and external market opportunities would allow Nepal’s growth to accelerate. The economy has the potential to grow at a higher rate than the 5.0% achieved during FY1992– FY1996, the period after its economy was first liberalized but before the onset of its armed civil conflict.

B. Economic performance

2. Economic growth. Despite the global economic slowdown and a difficult and protracted post-conflict political transition, Nepal’s economic growth and overall macroeconomic situation have been stable, if modest. Nepal maintained an average real GDP growth rate (basic prices) of 4.0% during FY2010-FY2013. Service sector growth, aided by a high inflow of remittances and tourism receipts, and good agriculture harvests due to a favorable monsoon have been principally responsible for the growth, despite the weak performance of the industrial sector. In FY2012, the GDP growth rate (basic prices) was 4.5%, the highest achieved during the 2010-2012 period covered by the previous country partnership strategy. The major contributors to service sector growth were hotels and restaurants; transport, storage, and communications; and wholesale and retail trade. All grew at more than a 5.0% annual average between FY2010 and FY2012. The manufacturing growth rate was barely 2.0% a year during the same period. A slowdown in real estate and housing markets impacted construction activities, whose growth declined  from  a  high  of  6.2%  in  FY2010  to 0.1%  in  FY2012.  Following  an  unfavorable monsoon and a shortage of chemical fertilizers, GDP growth dropped to 3.6% in FY2013.

3. Structural  transformation.  The  economy  is  not  following  the  traditional  mode  of structural transformation, i.e., through a decline in dependence on the agriculture sector and an increase in dependence on the industrial sector, including manufacturing. Instead, it is increasingly driven by the service sector, which is resulting in a slow structural transformation. While the contribution of agriculture sector has averaged 35.0% of GDP since FY2004, the contribution of the industrial sector declined to 15.0% of GDP in FY2013 from more than 17% in FY2004. The contribution of the service sector increased from about 46.0% of GDP in FY2004 to 51.0% in FY2013. The structural transformation is largely driven by service sector growth, especially in real estate, housing, construction, tourism, and retail activities that is in turn driven by high foreign remittances. The stagnant industrial sector is a cause for concern.

4. Fiscal performance. Fiscal performance has been sound and the budget deficit low and stable.  Some challenges  persist,  however.  These  are  related  in  particular  to  high recurrent expenditures, increasing subsidies, and a potential decline in the growth of revenue mobilization due to slowing growth in remittances, which primarily is used to finance most of the imports. Customs and value-added tax on imported items form the largest portion of the overall revenue mobilization. A limitation on changing the rates and composition of taxation as a result of a partial FY2013 budget—an outcome of the lingering political disagreements—is another issue. The government’s increasing expenditure is being partly met by foreign assistance, which has helped  keep  the fiscal deficit  at  around  2.2% of  GDP.  Post-conflict  expenditures  related  to rehabilitation  and  reintegration  of  former  insurgent  fighters,  along  with  the  rising  subsidies (mainly  for  petroleum  fuel),  have  increased  recurrent  expenditures  from  12.7%  of  GDP  in FY2010 to 15.2% of GDP in FY2013. Meanwhile, capital expenditures have declined from 6.4% of GDP in FY2010 to an estimated 3.1% of GDP in FY2013. This has reflected a difficult political transition, repeated delays in bringing out a full budget, and the low absorption capacity of government agencies. About 34% of capital expenditure is financed by foreign aid.

5. Revenue   mobilization.   Despite   the   challenging   political   environment,   revenue performance has been strong. Total tax and non-tax revenue mobilization has increased in the post-conflict period, reaching an estimated 17.0% of GDP in FY2013. While tax revenue increased to 15.0% of GDP in FY2013 from just 8.8% of GDP in FY2006, non-tax revenue has on average remained around 2.0% of GDP. Reforms for enhancing the efficiency of tax administration, strengthening the tax monitoring and audit system, and widening the tax net have paid off. In 2012, the government unveiled a 2012–2015 reform plan and a 2012–2017 strategic plan for the Inland Revenue Department. These plans aim to increase tax revenue mobilization to 18.0% of GDP in FY2017.

6. External sector. Remittances of citizens working or living abroad have been crucial in maintaining overall external sector stability. While merchandise exports have been declining and were only 5.1% of GDP in FY2013, due primarily to loss of competitiveness and weak external demand, merchandise imports have been increasing. They equaled 32.2% of GDP in FY2013, resulting in a trade deficit equivalent to about 27.1% of GDP. The high demand for imported goods  is  largely  created  by  the  high  remittance  inflows,  which  reached  25.6%  of  GDP  in FY2013, as well as the absence of domestically produced goods. The remittances have also been a key to maintaining a current account and balance of payments surplus despite the wide trade  deficit. The  stability of  the  external sector  remains  vulnerable  to fluctuations  in  these inflows. For instance, the negative impact of a global economic slowdown on the growth of remittance inflows pushed the current account balance into negative territory in FY2010 and FY2011 and also resulted in a negative balance of payments in FY2010. In FY2013, high remittance  inflows  and  a favorable  services  account  led  to  current  account  and  balance  of payments surpluses. Foreign exchange reserves were sufficient to cover 8.9 months of imports of goods and non-factor services.

7. Debt  sustainability.  Nepal’s  external  debt  declined  sharply  from  27.6%  of  GDP  in FY2009 to 19.6% of GDP in FY2013. Total national debt decreased in the same period from 41.0% of GDP to 31.7%. Nepal has succeeded in managing and servicing its debt in a timely manner, with no defaults so far. Prudent fiscal policy (an overall fiscal framework and sustained improvement   in   revenue   mobilization),   timely   repayment   of   debt   obligations,   and   the concessional nature of the country’s external debt continued to contribute to the stability of its debt position. However, the possibility of a negative shock to remittance inflows and potential for turmoil in the country’s financial sector present risks to the country’s debt sustainability.

8. Inflation. A rise in global food, fuel, and commodity prices have  impacted prices in Nepal, as has inflation in India. The inflation rate reached double digits in FY2009 before subsiding to 9.6% in 2010–2012 and 8.3% in FY2012, thanks to a consistent decline in food and beverage prices. However, inflation inched up to 9.9% in FY2013, largely because of a low agriculture  harvest,  successive  increases  in  petroleum  prices,  a  continuing  depreciation  of Nepal’s currency against the United States (US) dollar, the impact of supply bottlenecks, and high inflation in India, which is Nepal’s largest trading partner. The Nepalese rupee is pegged to the Indian rupee.

9. Financial  sector.  Prudent  and  timely  policy  interventions  and  regulatory  reforms  by Nepal Rastra Bank (NRB), the central bank, have stabilized the financial sector after a severe liquidity crisis in FY2011. Credit flows increased by more than 15% during FY2011-FY2013. In FY2011, lower growth of claims on the private sector and low public expenditure resulted in net savings in the government account. The liquidity crisis in FY2011 was triggered by a slowdown in  the growth  of  remittances  and failure  to pass  a full budget  on time. The NRB  launched corrective policy measures swiftly to contain the situation. It instructed bank and financial institutions (BFIs) to reduce the share of real estate and housing loans in their overall portfolios to 25.0% by FY2012. It also placed limits on credit-to-deposit ratio BFIs and reintroduced a minimum statutory liquidity ratio for banks. The NRB has also  reformed the country capital adequacy framework of 2007 to bring it into line with the new BASEL II standards, and since FY2009 it has started full implementation of class A commercial banks. Based on the Basel II updated standards, it also started implementing the framework for class B (development banks) in FY2011. To increase access to finance and encourage BFIs to widen their operations beyond the urban areas, the NRB is offering special interest rate-based benefits to those that expand their businesses into rural areas. The financial sector is still vulnerable to fluctuations in remittance inflows, a slowdown in real estate and housing markets, and any financial turbulence involving the roughly 24,000 credit and savings cooperatives in the country. These cooperatives are outside the NRB’s regulatory purview and have amassed more deposits than development banks and finance companies combined.

10. Migration and remittances. More than 1,200 Nepalese leave the country every day due to the lack of job opportunities at home and the lure of high wages abroad. This outmigration to find work in destinations such as Malaysia and the Gulf States  has resulted in a shortage of workers in the agriculture and industrial sectors. Growing internal migration from rural to urban areas has further impacted the agriculture sector.  Against the backdrop of the weak industrial sector, lack of adequate investment, and an economy where demand for goods and services is largely met by imports, remittance inflows have been crucial in supporting not only macroeconomic stability but also household consumption and expenditures. A massive rise in these remittances, which more than 56% of households receive, has fuelled consumption of imported goods, contributed to a multifold rise in real estate and housing prices, and facilitated the rise of the number of banks and financial institutions. It has also supported high revenue mobilization,  increased  foreign  exchange  reserves,  helped  maintain  balance  of  payments stability  despite  a  widening  trade  deficit,  and  reduced  absolute  poverty.  Remittances  are impacting almost all levels of the economy. They also contributed to problems related to the so- called Dutch Disease, which foreign funds inflows drive up the value of a country’s currency, making its export prices uncompetitive, and results in a decline in activity in the tradable sector (mainly manufacturing) compared with that in the non-tradable sector (mostly services).

11. Emerging challenges. The country’s key economic challenge is to generate the high, inclusive, sustainable growth that is necessary to create employment opportunities for Nepal’s people, as well as more rapid and sustainable poverty reduction. To do this, the country must address its acute power shortage and overall infrastructure deficit. Both steps are critical to promoting private sector investments and effective public service delivery. The severe infrastructure deficit has combined with difficult labor–industry relations to form a key obstacle to the growth of the industrial sector, which is necessary for an economic structural transformation and the creation of  more jobs. Inadequate access to finance is also  a critical constraint to private sector investment and growth. Another challenge lies in the financial sector, which is vulnerable due to weak monitoring and supervision. This has left many BFIs, especially the smaller  ones,  poorly  managed  and  suffering  from  high  ratios  of  nonperforming  assets. Economic planning has also been inadequate. The country’s substantial remittance income has served to help maintain macroeconomic stability but it has not been channeled into productive investments for achieving higher, long-term, sustainable growth.

12. Competitiveness.  Although  it  enjoys  the  benefits  under  the  General  System  of Preferences of entry to the developed country markets and free trade with India, Nepal’s exports are declining. This is mainly due to its abundant domestic supply-side constraints, all of which limit the competitiveness of Nepalese products and inhibit private sector development. The country’s electricity shortage is crippling the industrial sector, and most firms operate below capacity. Manufacturing plants are compelled to use petroleum fuel generators when there is no electricity supply. This increases their cost of production and makes the final price of their goods uncompetitive. Nepal’s inadequate and insufficient electricity and transport infrastructure has been identified as a principal binding constraint on economic growth.  The poor state of labor relations is also a burden. The occasional strikes along the main highways and country-wide strikes have been disrupting production, supply, and distribution, especially after FY2006. Labor uncertainty has increased the lead time between the placement of an order and the receipt of goods from Nepal’s manufacturers, resulting in a drop in demand for the country’s exports. The combative labor–industry relationship has resulted in the closure of several factories, including those of multinational companies. Nepal’s labor costs are rising faster than productivity levels. The minimum wage, which has been raised many times since 2006, is the highest in South Asia. The lack of qualified workers has also affected production and wages.

13. Constraints  to  doing  business:  Successive  perception  surveys  of  the  business community incorporated in the World Economic Forum’s annual Global Competitiveness Report during 2010-2013 showed that government instability, corruption, inefficient government bureaucracy, policy instability, and restrictive labor regulations were the five greatest obstacles to  doing  business  in  Nepal.  The  other  negative  factors  identified  in  the  surveys  were  poor access to finance, a poor labor force work ethic, high inflation, crime and theft, an inadequately educated work force, tax regulation, tax rates, insufficient capacity to innovate, foreign currency regulation, and poor public health. A business survey conducted in 2012 by the Federation of Nepalese Chambers of Commerce and Industry identified political instability as the most critical challenge facing the economy, followed by the insufficient energy supply, poor governance, labor problems, strikes, and financial sector instability.

C. Economic outlook

14. Higher growth potential. In FY2013, the growth rate (at basic prices) was an estimated 3.6%, down from 4.5% in FY2012.  Growth slowed main because of a delay in the monsoon and a shortage of chemical fertilizers during the peak paddy planting season, both of which affected agriculture production.  GDP growth was also adversely affected by delays in passing a full budget  and  a  deceleration  of  remittances  inflows, which  impacted  service  sector  growth, financial sector stability, and the balance of payments. Nevertheless, the growth rate since 2008 has been 4.4%, demonstrating the economy’s resilience in the face of political instability. Nepal has natural resource endowments; access to the large, fast-growing, nearby markets of the People’s Republic of China and India; and comparative advantages in key sectors such as hydropower, tourism, and agriculture. The country has the potential to achieve growth rates of 6%–7%. For this to happen, however, it must tackle its binding constraints, the foremost being its infrastructure bottlenecks. The acute electricity shortage, which exists despite the country’s enormous hydropower potential, is severely constraining all economic activities and private investments above all.  The inadequate transport networks, urban infrastructure, and irrigation systems also limit the expansion of economic opportunities. At present, the country’s economic base is narrow and heavily dependent on remittance incomes. Agriculture and services activities are characterized by low productivity. Manufacturing sector activities remain stagnant due to infrastructure  bottlenecks,  difficult  industrial  relations,  and  an  unfavorable  business environment.

15. Inclusive growth. While Nepal made impressive progress in the past decade toward achieving  inclusive  growth,  much  more  needs  to  be  done  to  sustain  and  accelerate  this success. High, sustainable growth is fundamental to generating greater and better employment opportunities. To be inclusive, the country’s growth needs to be employment-centric. Under the current  economic  situation,  however,  the  vast majority of  the  450,000 entrants to the  labor market every year resort to either low-skilled jobs overseas or low-value-added service sector activities domestically. A weak education system and a low skills base are key constraints to promoting economic diversification and higher competitiveness. The technical and vocational education sector needs to be expanded and restructured to respond to the needs of the labor market  more  effectively.  The  quality  of  education  also  requires  major  upgrading  to  provide greater access to secondary and tertiary education and make that education more relevant to the students’ and the economy’s needs. To diversify its economy and accelerate inclusive economic growth, Nepal also needs to improve other basic services, such as health, water and sanitation, and electricity, as well as provide better manufacturing production and delivery, enhance the capacity of small and medium-sized enterprises, open appropriate microfinance avenues for promising enterprises, and make other reforms that support inclusion. It must strengthen its social protection programs to prevent extreme depravation and shield the poor and vulnerable groups from negative exogenous shocks to their incomes and livelihoods. It also requires more work on labor market policies and programs, social insurance programs, social assistance and welfare schemes, child protection programs, and disaster risk management that focuses on vulnerable populations.

16. Accelerating inclusive growth will require a substantial increase in capital investments. The government’s capital expenditure stood at barely 3.1% of GDP in FY2013, sharply down from 6.6% of GDP in FY2013. Public capital investment should be raised to at least 8% of GDP by (i) rationalizing recurrent expenditures, including though reforms of loss-making public enterprises such as the NEA and the Nepal Oil Corporation (NOC); and (ii) enhancing  the capacity of public agencies to deliver and sustain quality infrastructure in a timely and effective manner. Strategic planning of infrastructure is critical to maximize growth and the employment impacts of industrial growth. Private investments in infrastructure need to be promoted, particularly in the energy sector to address the crippling domestic power shortage and tap huge potentials for exports. This calls for creating an enabling environment for PPP. PPPs will provide a basis for developing private industries. Labor-intensive manufacturing, agroprocessing, and modern services must grow. Private investments, including foreign direct investment (FDI), need to be attracted by improving the investment climate, incentives, labor relations and laws, and social security systems. Growth frontiers should be identified and nourished to promote exports and  substitute  imports  in  areas  where  Nepal  can  be  competitive.  Pursuing  integration  with rapidly growing neighboring economies can further accelerate the process.

17. Investment. The total domestic capital investment commitment by registered industries reached NRs84.4 billion in FY2012, or 5.5% of GDP. The largest share of investment is usually in the energy sector (3.6% of GDP in FY2012), followed by manufacturing (1.1% of GDP), services (0.3% of GDP), and tourism (0.1% of GDP). While still very small, the upward trend in FDI inflows is likely to continue, given the high investments, both existing and planned, in the hydropower, transport, and services sectors. Total FDI inflows, as recorded in the balance of payments, increased from $5.45 million in FY2008 to $103.60 million (0.5% of GDP) in FY2012. There is much scope for FDI to increase—the existing inflow is a mere 0.3% of total FDI in South Asia. While domestic and foreign investments are increasing in the infrastructure (particularly hydropower), tourism, and retail sectors, the same is not true for agriculture and manufacturing, and in other services subsectors. A gradual relaxation of the supply-side constraints (such as the electricity shortages, market distortions produced by middlemen and syndicates, poor industrial relations, a lack of qualified workers, the skills gap, and inadequate supply of  agricultural and  industrial inputs)  would  attract more  investment,  which  is  vital  to generate enough employment opportunities to absorb the nearly half a million new entrants to the labor force each year. While the capital market needs to be developed for long-term private sector investment in infrastructure, the PPP modality seems a good option for investment needs in the interim. 

18. Inflation and monetary conditions. Inflation will be largely determined by the prices in neighboring India, international fuel prices, food prices, and rigidity in the supply bottlenecks. Given  the  impact  of  unfavorable  rainfall,  droughts  in  major  crop-producing  countries,  and potential trade restrictions that might be imposed by major grain exporters, global food prices are projected to remain high in the coming years. This could be reflected in domestic prices to some extent, leading to high inflation. In FY2013, inflation was 9.9%, up from 8.3% in FY2012. Meanwhile, in the financial sector, a market correction is ongoing in real estate and housing prices, and the BFIs are adjusting their loan portfolios to comply with the NRB’s directives. Aiming to consolidate the BFIs and reduce their numbers, the NRB and the Ministry of Finance MOF  are  encouraging  mergers.  The  government   is  also  planning  to  introduce  stricter regulations and supervision of proliferating credit and savings cooperatives, whose risky deposit and lending behavior might negatively impact the financial sector at large and, through it, the real sector. Assuming a steady increase in the growth of remittances and tourism receipts, the balance of payments will remain positive.

19. Exchange rate volatility. As a result of the peg with the Indian rupee, the Nepalese rupee has also depreciated rapidly against the US dollar. Concerns over a prospective winding down of quantitative easing by the US Federal Reserve triggered the depreciation of the Indian rupee. The decline was complicated by India’s slow economic growth and a widening current account deficit. The depreciation of Indian rupee is automatically reflected in the exchange rate of the Nepalese rupee against the US dollar (declines of 19.9% in FY2012 and further 6.7% in FY2013). If Nepal’s currency continues to weaken at this rate, (i) the government’s debt service payments will rise; (ii) the NOC will incur heavy losses as it procures petroleum products and liquefied gas at higher prices and sells them at subsidized prices in the domestic market; (iii) the NEA’s payments to the independent power producers with which it has power purchase agreements in foreign currency will go up, further exacerbating its balance sheet issues; and (iv) Nepal’s  import  bill will increase. These factors may influence macroeconomic  stability,  debt sustainability,  and  balance  of  payments  stability.  The  government’s  liabilities,  including  the losses of the NOC and the NEA, would increase and the credibility of the NEA as an energy offtaker could further erode. The higher cost in Nepalese rupees to service external debts might impact debt sustainability. However, given the incentives that such a continued current depreciation could provide for workers abroad to remit more money, the balance of payments might not see much deterioration despite the likely rise in the trade deficit. While the exchange rate volatility has severe negative implications for certain public entities and macroeconomic variables (state-owned enterprises, inflation, and balance of trade), it may have mild and mixed impact on other variables such as GDP growth, debt sustainability, and external sector stability.

20. Overall,  Nepal is  expected  to  maintain  macroeconomic  stability,  thanks  to  continued revenue administration reforms and growth in revenue mobilization, high remittance inflows, and prudent fiscal and monetary policies. If it can made progress in its political transition, resolve its supply-side constraints, and carry out further reforms to boost private sector investment, Nepal has the potential to achieve a high growth rate in the years ahead.