On 12 May 2020, Prime Minister Narendra Modi announced a special economic package worth INR 20 lakh crore (INR 20 trillion or about USD 267 billion), which taken together with the earlier announcements by the government and RBI is equivalent to about 10% of GDP, with a focus on a self-reliant India (Atmanirbhar Bharat). On 26 March 2020, the government had announced an economic relief package (PMGKP) worth INR 1.7 lakh crore while the RBI offered liquidity support of INR 3.7 lakh crore in March and INR 2 lakh crore in April.
The Atmanirbhar Bharat Abhiyan (ABA) has five pillars and will focus on land, labor, liquidity, and laws.
- Quantum jump in economy
- Modern infrastructure
- Technology-driven system/reforms
- Vibrant demography
- Strong demand
The main idea is to build back better so that the eventual economic recovery is better than before and India is better positioned to respond to any future health or natural crises. Some of the measures (such as direct cash transfers and food subsidy) are designed to negate the effect of crisis such as COVID-19. The reform measures will not only enhance efficiency across sectors, but also ensure quality and push India towards a self-reliant economic regime.
The government is aiming for bold reforms in supply chain in agriculture, rational tax system, simple and clear laws, competent human resource, and a strong financial system. Make in India campaign will benefit from these reforms as the emphasis is on meeting demand locally but competitively. The expectation is that these measures will lead to the emergence of confident and resilient India that depends on its strengths and also integrates with the global economy.
Following up on PM Modi’s announcement, on 13 May 2020, Finance Minister Nirmala Sitharaman, provided details, in five tranches (Part 1, Part 2, Part 3, Part 4, and Part 5), of the comprehensive package.
The extra fiscal spending will be a fraction of INR 20 trillion as most are related to providing or leveraging liquidity, providing guarantees, and regulatory tweaks. The guarantees and backstops increase contingent liabilities on government, to the extent they are utilized. The following table gives an overview of the estimated fiscal cost or stimulus (1 USD = INR 75).
Self-reliant India movement economic package
|
|||
Sectors
|
INR crores
|
USD billion
|
Fiscal stimulus or
cost
|
Before May 13
|
|||
Revenue loss due to tax concessions since 22 March
|
7,800
|
Tax relief
|
|
PMGKY
|
170,000
|
22.7
|
102,600
|
Emergency Health Response Package
|
15,000
|
2.0
|
15,000
|
Total
|
192,800
|
25.7
|
|
Tranche 1-For businesses
including MSMEs
|
|||
MSMEs
|
|||
Emergency collateral-free working capital facility
|
300,000
|
40.0
|
|
Subordinate debt for stressed MSMEs
|
20,000
|
2.7
|
4,000
|
MSME Fund of Funds
|
50,000
|
6.7
|
10,000
|
EPF
|
|||
Extend EPF support for 3 more months
|
2,500
|
0.3
|
2,500
|
Reduction in employer & employee contribution to 10% from
12% for 3 months
|
6,750
|
0.9
|
Tax relief
|
NBFCs/MFIs
|
|||
Special liquidity scheme for NBFC/HFC/MFIs
|
30,000
|
4.0
|
|
Partial credit guarantee scheme
|
45,000
|
6.0
|
20% of loss if
incurred
|
DISCOMs
|
|||
Liquidity injection
|
90,000
|
12.0
|
|
Tax relief
|
|||
TDS and TCS reduced by 25% for FY2021
|
50,000
|
6.7
|
Tax relief
|
Total
|
594,250
|
79.2
|
|
Tranche 2-For poor,
including migrants and farmers
|
|||
Migrant workers welfare
|
|||
Free food grains supply to migrant workers for two months
|
3,500
|
0.5
|
3,500
|
Farmers and small businesses
|
|||
2% Interest subvention for 12 months for Shishu MUDRA loanees
|
1,500
|
0.2
|
if incurred
|
Credit facility for street vendors
|
5,000
|
0.7
|
if incurred
|
Extension of Credit Linked Subsidy Scheme under PMAY (Urban)
|
70,000
|
9.3
|
if incurred
|
Additional emergency working capital for farmers through NABARD
|
30,000
|
4.0
|
if incurred
|
Concessional credit to PM-KISAN beneficiaries
|
200,000
|
26.7
|
if incurred
|
Total
|
310,000
|
41.3
|
|
Tranche 3-Formalizaiton
of Micro Food Enterprise (MFE)
|
|||
Strengthen infrastructure logistics and capacity building
|
|||
Agri Infrastructure Fund
|
100,000
|
100,000
|
|
Formalizaiton of Micro Food Enterprise (MFE)
|
10,000
|
10,000
|
|
Pradhan Mantri Matsya Sampada Yojana (PMMSY)
|
20,000
|
20,000
|
|
Animal Husbandry Infrastructure Development Fund
|
15,000
|
15,000
|
|
Promotion of herbal cultivation
|
4,000
|
4,000
|
|
Beekeeping initiatives
|
500
|
500
|
|
TOP to TOTAL
|
500
|
500
|
|
Total
|
150,000
|
20.0
|
|
Tranche 4-New horizons
of growth- Structural reforms in eight sectors
|
|||
Social infrastructure VGF
|
8,100
|
8,100
|
|
Total
|
8,100
|
1.1
|
|
Tranche 5-Government
reforms and enablers
|
|||
MGNREGS
|
40,000
|
40,000
|
|
Total
|
40,000
|
5.3
|
|
RBI measures-actual
|
801,603
|
106.9
|
|
Grand total
|
2,096,753
|
279.6
|
335,700
|
Share of total
|
16.0
|
||
FY2020AE NGDP
|
2,998.6
|
22489420
|
|
Share of NGDP FY2020AE
|
1.5
|
||
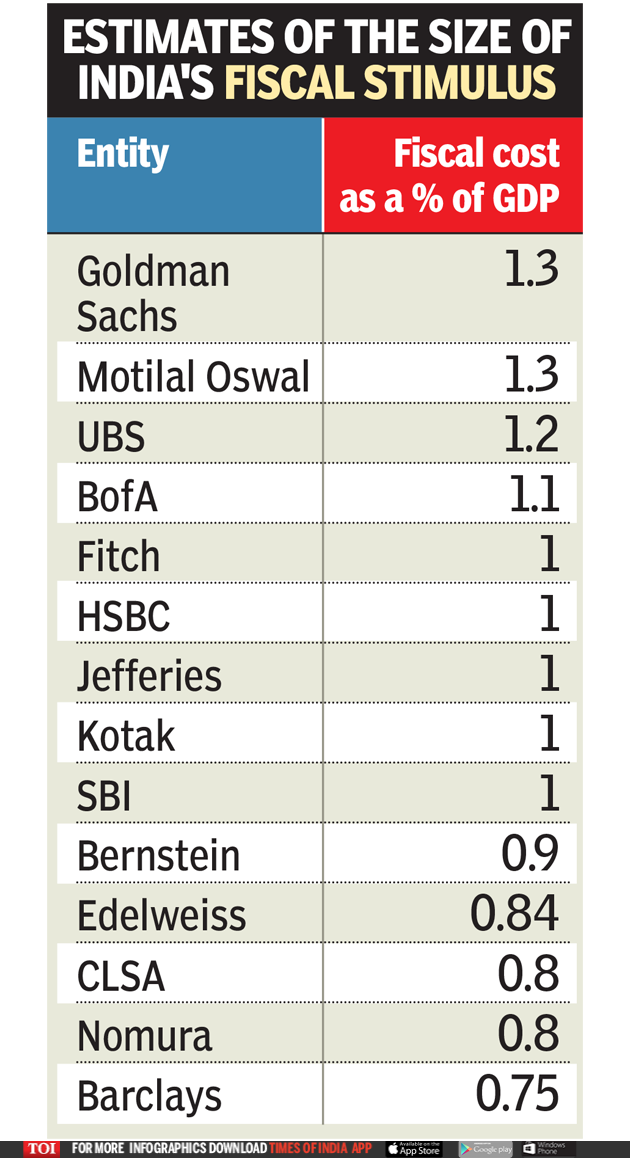
When the size of fiscal stimulus is expressed as share of GDP, then one confusion is which year’s nominal GDP to use. If folks use FY2020 advanced estimate of nominal GDP, then it may not be correct because nominal GDP is sure to decline as the advance estimate was released before COVID-19 pandemic. But then, if folks revise FY2020 nominal GDP downward then the size of fiscal stimulus as a share of GDP will increase compared to FY2020 AE. If folks are using FY2021 nominal GDP forecast, then the variability in size of fiscal stimulus is unsurprising. Furthermore, note that some of the fiscal stimulus may not be realized in FY2021 itself. So, expressing fiscal stimulus as a share of GDP is not uniform across estimates by different organizations. That said, most of the estimates are between 1-2% of GDP.
While some argue that the economic package is inadequate to address the economic challenges, other counter that it is appropriate for the time being.