Two months has passed since the catastrophic 7.8 magnitude earthquake struck Nepal on 25 April 2015. More than 338 aftershocks of over 4 magnitude (including 6.7 magnitude on 26 April and 7.3 magnitude on 12 May) were recorded by the National Seismological Center (as of 1 July).
The earthquake and subsequent aftershocks severely hit the upper and middle belt of central and western administrative regions. 31 of the 75 districts were affected and 14 of these were declared ‘crisis-hit’ to prioritize rescue and relief operations. About 8,500 people are dead, 22,307 injured and over a half a million houses fully damaged. In addition, public infrastructure and services are either destroyed or disrupted.
Impact on GDP growth
According to the preliminary estimates published on 8 June by Central Bureau of Statistics, the earthquake lowered GDP growth by over 1.5 percentage points from an estimate of 4.6% in a no-earthquake scenario in FY2015 (ends 15 July 2015). This new estimate is in line with the lower growth forecast mentioned on 22 May blog post.
Figure 1: GDP growth (basic prices), %

Source: Central Bureau of Statistics
Although the earthquake struck Nepal in the tenth month of FY2015, the impact on GDP growth seems to be sizable especially on the services sector, which is expected to grow by 3.9% compared to 6% in a no-earthquake scenario. Wholesale and retail trade; tourism activities (affects air transport, and hotel and restaurant businesses); real estate, renting and business activities; and education sub-sectors are the most affected.
Agriculture sector is expected to grow by 1.9% and industry by 2.7%, down from earlier no-earthquake scenario forecast of 3% and 3.5%, respectively. The sharp drop in agricultural output is primarily due to the negative impact of delayed and weak monsoon in the first half of FY2015, and later the loss of livestock due to the earthquake.
The slowdown in industry sector is due to the drastic drop in quarrying (stones, aggregates, sand and soil extraction slowing down in affected districts, and the moratorium on construction activities till mid-July 2015); manufacturing (physical damage, labor shortage and weak demand); and construction (policy to temporarily halt construction activities, and low production of construction materials, among others).
Figure 2: Gross value added loss in FY2015 ($ million)
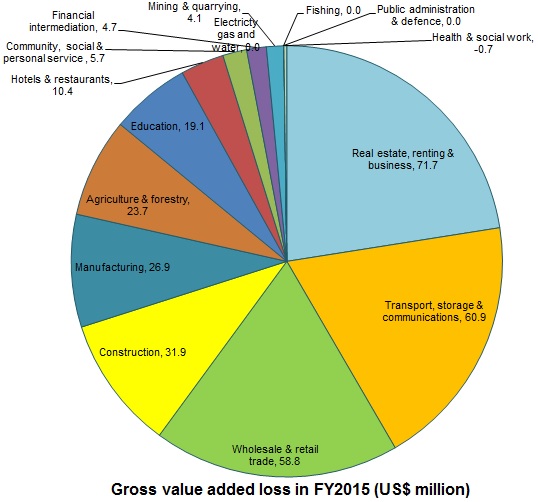
Source: Central Bureau of Statistics
Nepal’s GDP is estimated to be $21.6 billion in FY2015 ($371 million less than what would have been in a no-earthquake scenario). The loss amounts to 1.5% of GDP. About 62% of the total gross value added (GVA) loss is accounted for by the services sector.
Impact on per capita income
Per capita GDP is estimated to decrease by $23 compared to the no-earthquake scenario (in which case per capita income would have been $785). Real per capita GDP increased by just 0.6% against 3.6% in a no-earthquake scenario.
Figure 3: Nominal per capita GDP (US$)

Source: Central Bureau of Statistics
Impact on poverty
Preliminary estimates show that the income shock as a result of the earthquake will likely push an additional 700,000-982,000 people below the poverty line. This translates into an additional 2.5%-3.5% of the estimated population in 2015 pushed into poverty compared to the no-earthquake baseline scenario of about 21%. About 50%-70% will come from rural Central hills and mountains, where the vulnerability prior to the earthquake was already high. The income shock is largely felt though the loss of income-generating opportunities/livelihoods (including death and injuries to primary wage earners) and the loss of housing, productive assets (seeds, livestock, and farm equipment), and durable assets (assorted household items).
Beyond this monetary-based poverty estimate, a larger impact can be expected when factoring in multidimensional poverty, which includes additional factors such as water and sanitation services, disruption of schools and health services and the possibility of an uptick in food insecurity. The poor and vulnerable are particularly dependent on local infrastructure (roads, bridges, health posts, and schools) for access to labor and commodity markets, and for accumulation of human capital (especially those of children). Reviving local economic activities and resumption of basic public services along with an accelerated implementation of reconstruction projects will be critical to make up for the set back on poverty reduction caused by the earthquake.
Post-disaster needs assessment (PDNA)
The total economic cost of losses and for recovery will be much higher than the loss of flow of economic activities in FY2015. According to PDNA estimates, the cumulative damage and loss amounts to 33.3% of GDP ($7.1 billion) and the cumulative need for recovery is estimated at $6.7 billion (31.5% of GDP).
Table 1: Damages, losses and needs ($ billion)
| PDNA (US$ billion) |
| Sector Themes | Included sectors | Damage | Loss | Total needs |
| Social | Cultural Heritage, Education, Health and Population, Housing and Human Settlements | 3.5 | 0.5 | 4.0 |
| Productive | Agriculture, Financial Sector, Industry and Commerce, Irrigation, Tourism | 0.6 | 1.2 | 1.2 |
| Infrastructure | Communications, Community Infrastructure, Electricity, Transport, Water and Sanitation | 0.5 | 0.1 | 0.7 |
| Cross-Cutting | Gender, Social Protection, Nutrition, Employment & Livelihoods, Disaster Risk Reduction, Environment and Forestry, Governance | 0.5 | 0.3 | 0.8 |
| Total | | 5.1 | 2.1 | 6.7 |
Source: PDNA Secretariat, National Planning Commission
Of the total estimated need for recovery, about 50% is accounted for by private housing and settlement. Productive and infrastructure clusters account for 17.3% and 11.1%, respectively, of the total estimated need for recovery. It amounts to about 5.5% and 3.5% of GDP, respectively. The recovery need requirement for agriculture, education, electricity, and transport is estimated at $156 million, $397 million, $186 million, and $282 million, respectively. Furthermore, recovery of tourism sector and restoration of cultural heritage are estimated to require $387 million and $206 million, respectively.
Reconstruction conference
On 25 June, the government organized an international conference on Nepal’s reconstruction (ICNR). High level representatives from over 50 countries and multilateral agencies participated in the conference.
ADB, represented by its president, Takehiko Nakao, pledged $600 million—including $200 million emergency assistance approved by its Board of Directors on 24 June—to cover a part of the need to rebuild school buildings, roads and public buildings.
The government estimated that the total pledging was to the tune of $4.4 billion (equally spilt in grants and concessional loans). India and Peoples’ Republic of China committed $1 billion and $483 million, respectively. World Bank, Japan, the US and the EU pledged $500 million, $260 million, $130 million, and $112 million, respectively.
According PDNA, total public sector losses and damages amount to $1.7 billion, which excludes housing. The National Planning Commission estimated that about 57% of the recovery needs ($3.8 billion), including housing, will have to be shoulder by the government. In this respect, the total pledged amount is higher than the public sector recovery needs till the medium-term. However, a much higher amount of investment may be needed in the long-term to build better and earthquake-resilient public infrastructure throughout the country.
Figure 4: Aid pledged at ICNR ($ million)

Source: Authors’ compilation
Way forward
The way forward will not be easy given the huge challenges. ADB has indicated five principles of effective reconstruction: (i) building back better; (ii) inclusiveness; (iii) robust institutional set up for reconstruction; (iv) sound governance and fiduciary risk management; and (v) effective donor coordination and government ownership.
As part of that, some of the important tasks are:
-
Operationalize the National Reconstruction Authority and fill key posts with competent professionals.
-
Ensure the pledged aid is fully spent. For this, the government needs to come up with viable project proposals and address concerns related to the budget execution capacity and governance structure of the proposed authority.
-
Ensure swift and effective decision making on the reconstruction program, especially on planning, budget allocation and execution, supervision, monitoring and evaluation. Outsourcing design, supervision and management of reconstruction projects may be needed if government capacity is limited.
-
Prepare a time-bound project implementation plan with broad political ownership.
-
Continue reforms to increase private sector investment, especially with an aim to initiate some of the reconstruction projects on a public private partnership (PPP) basis. This will require the government to pass the nearly finalized PPP Policy and speedily enact Nepal’s PPP Act. Other policies and acts prepared or updated with the aim to develop the private sector and increase their investment also need to be passed or enacted in an expeditious manner.
-
Link the reconstruction activities with the development of a long-term economic development vision, which includes increasing per capita income to the level of a middle-income country by 2030. It is especially important because the PDNA did not include earthquake-resilient reconstruction throughout the country. The cost of rebuilding houses beyond the set size, retrofitting standing buildings in Kathmandu Valley and affected districts, and nationwide resilience (such as ensuring housing and school safety across the country) need to be kept in mind while planning and initiating rehabilitation and reconstruction projects.
-
Rehabilitation and reconstruction should primarily aim at increasing productivity-enhancing public capital investment. This is key to ensuring a structural transformation with high value-added and high-productivity sectors more dominant than low value-added and low-productivity sectors in the medium term. Promoting agribusiness, industrial capacity, innovation and high-productivity services need to be at the center of such a structural transformation strategy.
This blog post is in line with this and this blog posts on Asian Development Blog.


