This paper studies the trade of China in the past 150 years, starting from the first opening of China after the Opium War. The main purpose of the paper is to identify what is (and was) China’s ‘normal’ level of foreign trade, and how these levels changed under different trade regimes, from 1840 to the present. We present new evidence on China’s foreign trade during the treaty port era (1842-1948), drawn from disaggregated trade data collected by the Chinese Maritime Customs Service, that yields important findings for current research. First, although the volume of foreign trade remained limited initially, there was a notable expansion in the diversity of products, with many new goods being imported into China. Second, the regional diffusion of foreign goods through China was greatly facilitated by the expansions of the port system. Third, the importance of Hong Kong as an intermediary in China’s trade has undergone long-term fluctuations suggestive of learning effects. China’s recent wave of liberalization has led by the early 1990s to a trade level comparable to the high of the 1920s. While much of China’s recent growth in world trade is in line with her income growth, there is no doubt that China’s trade openness today, comparable by some measures to Denmark’s, is a stunning reversal relative to the pre-1978 and also the pre-1840 period. The paper emphasizes the roles that history and institutional change have played in this.
Here is the paper written by Wolfgang Keller, Ben Li, and Carol H. Shiue.
Before the twentieth century, China’s top two import destinations were Hong Kong and Great Britain. Meanwhile, its top two export destinations were Great Britain and Hong Kong. Overall, it traded more with Hong Kong, the Europeans, and British India.
| China's Average Trade Shares, 1865-1900 (percent) |
| Imports | | Exports | |
| Hong Kong | 41.36 | Great Britain | 31.65 |
| Great Britain | 24.82 | Hong Kong | 26.94 |
| British India | 18.23 | Continental Europe | 11.86 |
| Japan | 5.8 | USA | 11.07 |
| USA | 2.65 | Russia | 5.82 |
| Continental Europe | 2.31 | Japan | 4.93 |
| Other Countries | 4.84 | Other Countries | 7.73 |
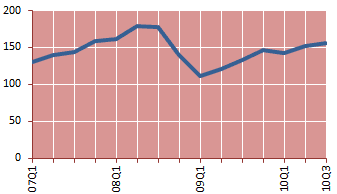
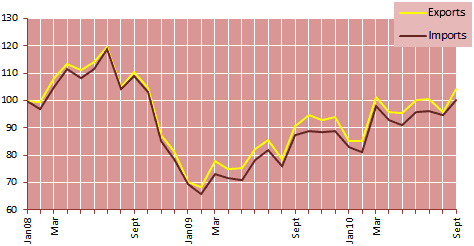
 From January to September trade expanded by 23%, continuing the recovery that began in the second quarter of 2009. Despite this positive trend, the value of world trade remains below its peak level from before the present financial crisis. (The chart on the left shows world merchandise exports, Q12005=100).