This is adapted from Macroeconomic Update, August 2015, Vol.3, No.2 (executive summary here, and FY2016 growth and inflation outlook here). It presents is the composition of Nepal’s outstanding internal and external debt. The Macroeconomic Update includes FY2015 update on real, fiscal, monetary and external sector, and growth and inflation outlook for FY2016. It provides a comprehensive macroeconomic assessment, including fiscal sustainability, after the April 25 earthquake.
I. Remittances
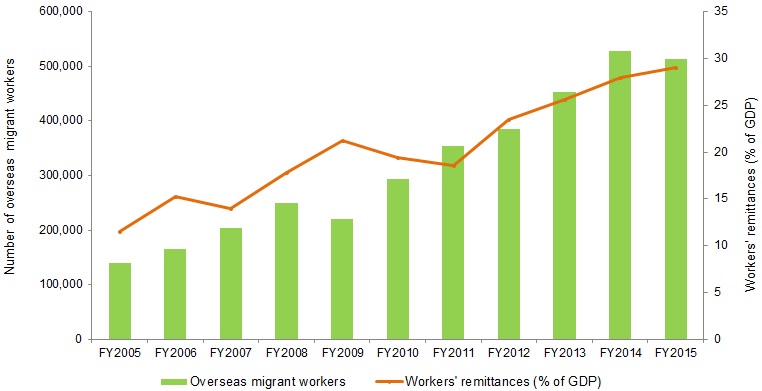
Despite the deceleration of remittance inflows till the third quarter of FY2015, the earthquake in the last quarter prompted migrant workers to drastically increase the amount of income remitted to Nepal. Consequently, workers’ remittance inflows reached a record 29.1% of GDP in FY2015, equivalent to $6.2 billion (Figure 1). In US$ terms, remittance inflows grew by 12.2%, marginally up from 11.9% growth in FY2014.[1] This follows a 16.4% growth of migrant workers (those who obtained permits form the Department of Foreign Employment).
Figure 1: Number of migrants and remittance inflows
II. Migration
According to the Department of Foreign Employment, growth of migrant workers decreased by 2.8% (Table 1) against a growth of 16.4% in FY2014 as recruitment process got derailed for over a month and potential migrant workers deferred travel plans in view of the immediate relief and temporary reconstruction works needed in the earthquake affected areas. A total of 512, 887 migrants legally left to work overseas in FY2015 (daily average of 1,405), down from 527,814 in FY2014 (daily average of 1,466). Malaysia, Qatar, Saudi Arabia, and UAE have remained the top employment destinations for low and semi-skilled Nepalese migrant workers (Figure 2). They together accounted for 92% of total migrant workers in FY2015. As a share of total migrants, Malaysia’s share increased from 34.6% in FY2013 to 40.6% in FY2014, but declined to 39.5% in FY2015. Meanwhile, Qatar’s share also decreased from 24.4% in FY2014 to 24.2% in FY2015. Saudi Arabia, Japan and South Korea absorbed higher share of migrant workers when compared to the shares in FY2014.
Figure 2: Destination-wise distribution of labor migrants

Table 1: Monthly out-migration
| Number of migrants | Y-o-Y growth | |||
| mid-month | FY2014 | FY2015 | FY2014 | FY2015 |
| August | 45,519 | 42,309 | 39.3 | -7.1 |
| September | 24,214 | 51,551 | -13.8 | 112.9 |
| October | 31,959 | 35,550 | -15.9 | 11.2 |
| November | 31,949 | 43,213 | 24.7 | 35.3 |
| December | 41,634 | 53,354 | 19.1 | 28.2 |
| January | 50,032 | 45,362 | 22.4 | -9.3 |
| February | 37,285 | 48,941 | -0.5 | 31.3 |
| March | 48,552 | 44,460 | 24.2 | -8.4 |
| April | 45,854 | 52,210 | 10.1 | 13.9 |
| May | 54,173 | 31,375 | 37.9 | -42.1 |
| June | 54,926 | 37,962 | 21.0 | -30.9 |
| July | 61,717 | 26,600 | 22.3 | -56.9 |
| Total | 527,814 | 512,887 | 16.4 | -2.8 |
III. Balance of payments
Despite the weak currency, which improved relative price competitiveness, exports failed to pick up in the first three quarters and then plunged drastically as production got severely affected by the April earthquake and its aftershocks. Merchandise exports (free on board [fob]), in US dollar terms, decreased by 3.9%-- a sharp fall from 5.1% growth in FY2014. The country exported merchandise goods worth $990.8 million, down from $1.03 billion in FY2014. Overall, merchandise exports decreased to 4.6% of GDP in FY2015 from 5.2% of GDP in FY2014. Exports to India, the People’s Republic of China (PRC), and other countries accounted for 65.5%, 2.6% and 31.9%, respectively, of total exports in FY2015.
Merchandise imports growth (cost, insurance freight [cif]) in dollar terms slowed down to 8.0% from 13.9% growth in FY2014 as it got hit due to the severe disruption in economic activities and a slump in import demand following the earthquake. Of the total imports of $7.6 billion, 14.7% was oil imports. In US dollar terms, this is equivalent to $1.1 billion, higher than the value of the country’s total merchandise exports but lower than the oil import bill in FY2014. This is primarily due to the low international oil prices and the weakening of aggregate demand in the last quarter of FY2015. Overall, merchandise imports stayed unchanged at 35.9% of GDP in FY2015 and FY2014. Imports from India, PRC, and other countries accounted for 63.5%, 12.9% and 23.6%, respectively, of total imports in FY2015.
Figure 3: Balance of payments (% of GDP)

The country’s external situation strengthened in FY2015 with the balance of payment surplus reaching $1.5 billion (6.8% of GDP). Though this is an impressive increase from the $1.3 billion (6.5% of GDP) surplus in FY2014, it is still lower than the $1.6 billion (8.2% of GDP) surplus in FY2012 (Figure 3). The large merchandise trade deficit, which reached 31.2% of GDP, was partially[2] offset by workers’ remittances, which reached a record 29.1% of GDP, and export (4.6% of GDP), resulting in a current account surplus of $1.1 billion (5.1% of GDP), up from 4.6% of GDP in FY2014. While capital transfers decreased by 14.3%, financial transfers increased by 57.0% as a result of the 35.5% jump in foreign direct investment, amounted to $44.2 million. Gross foreign exchange reserves increased from $6.8 billion in FY2014 to $8.3 billion FY2014, sufficient to cover 11.2 months of imports of goods and non-factor services.
[1] In local currency, the growth rate was 13.6% in FY2015, down 25.0% growth in FY2014.
[1] Overall, the net goods, services and income balance was a negative 28.3% of GDP, which was offset by net transfers equivalent to 33.4% of GDP, resulting in current account surplus equivalent to 5.1% of GDP.