Thursday, March 31, 2011

Indian population at a glance, Census 2011

The Indian government has released provisional Census 2011 data. According to Census 2011, India has a population of 1.21 billion, up from 1.02 billion in 2001. Literacy rate in India is 74.04. Male literacy rate is 82.14 percent and female literacy rate is 65.46 percent. Population densticy is 382 persons per square kilometer. The sex ratio (females per 1000 males) is 940.

India's Census 2011
Population Absolute
Total 1,21,01,93,422 1.21 billion
Males 62,37,24,248 623.72 million
Females 58,64,69,174 586.46 million
Decadal population growth, 2001-2011 Absolute Percentage
Total growth 18,14,55,986 17.64
Males 9,15,01,158 17.19
Females 8,99,54,828 18.12
 
Population density (per sq. km.) 382
Sex ratio (females per 1000 males) 940
Population in age group 0-6 Absolute % of total population
Total 15,87,89,287 13.12
Males 8,29,52,135 13.3
Females 7,58,37,152 12.93
Literates Absolute Literacy rate
Persons 77,84,54,120 74.04
Males 44,42,03,762 82.14
Females 33,42,50,358 65.46

Wednesday, March 30, 2011

Links of interest (2011-03-30)

  • Rameshore Khanal, an honest civil servant working as finance secretary of Nepal, resigned due to undue pressure from Deputy Prime Minister and Finance Minister Bharat Mohan Adhikary and his cronies (including businessmen who were about to be charged for tax evasion).  God knows how much Adhikary and the political parties are being paid by the crooked businessmen to oust Khanal from the finance ministry. This is corruption and dirty lobbying at its height. The morale of civil servants will further go down. The optimal solution right now is to take moral responsibility by Adhikary, resign immediately, and recall Khanal without any preconditions. He should also apologize to Khanal and to the nation for discouraging an honest and dignified civil servant from working to his fullest capacity. Meanwhile, Khanal writes on his facebook profile: “Paid Civil Service is not the only place where one can work for Change, Change for Good. There is a wider civil society where we can work together. We can work collectively for a change that our country needs.”
  • South Asia and food crisis (About 75% of South Asia’s poor live in rural areas and agriculture sector employs about 60% of the labor force. With global food and fuel prices rising again, South Asia will be affected disproportionally. Regional inflation is already high and countries have limited fiscal space to maneuver.)
  • Exchange rate and trade regimes (Results suggest that both currency unions and direct pegs promote bilateral trade in Africa vis-à-vis more flexible exchange rate regimes, and that their effect is almost double for the region than that for an average country in the world sample.)
  • The Middle East political crisis and remittances flows to South Asia (The small share of South Asian workers and limited remittance flows from Libya, Egypt, and Tunisia mean that direct and immediate impacts on remittance flows to South Asian countries overall will be limited. Gulf States employ more than 11 million expatriate workers, an estimated 8 million or more from South and East Asian countries. Saudi Arabia, the U.A.E, and Qatar are top destination for South Asian migrants and are main sources of remittance inflows.)

    1. Effective policies and technology investments to minimize food–fuel competition.
    2. Social protection, especially social safety nets, for the most vulnerable groups.
    3. Transparent, fair, and open global trade.
    4. A global emergency physical grain reserve.
    5. Policies and investments to promote agricultural growth, in particular smallholder productivity, in the face of climate change.
    6. Investments by national governments in climate change adaptation and mitigation using the full potential that agriculture offers.
    7. An international working group to regularly monitor the world food situation and trigger action to prevent excessive price volatility.

Tuesday, March 29, 2011

Energy crisis in Nepal

Declaring “energy crisis” for the next four and a half years, the Nepalese government launched a $275 million initiative to supply 2500 MW of electricity within that period. This drastic move comes after years of power outages (load-shedding) in a country that has one of the highest potentials of hydropower. Note that the previous UML-led government had set an ambitious target of generating 25,000 MW of hydroelectricity in the next two decades, much above the past Maoist-led government´s target of generating 10,000 MW of power in 10 years. Progress in this front is almost nil.

During fiscal year 2009/10 the annual peak demand reached 885.28 MW, a 8.96 percent growth over the peak demand in previous fiscal year. Annual energy demand recorded 4367.13 GWh out of which 3076.69 GWh was met by domestic power generation, 612.58 GWh was imported, and 667.860 GWh was managed through load-shedding (Nepal Electricity Authority 2010). Currently, power outages have reached up to 14 hours a day.

Since supply of electricity is trailing behind demand for electricity by over 50 percent (on an average the demand is 900 MW, but supply is around 450 MW), especially during dry season, it has affected pretty much everyone in the country. Due to acute power crunch cost of production of industries is going up, cost competitiveness of Nepalese products is decreasing, industries are closing down, production is being winded down, a shortfall in domestic production is leading to an increase in imports of even the most basic goods and services (contributing to widening trade deficit), and future growth potential is being severely crippled. It will take years to make up for the lost growth potential due to the ongoing energy crisis even if the power outages are solved in five years time.

Some of the strategies of the present government:

  • Begin on a war footing the repair works at 39-megawatt multi-fuel plant in Duhabi, 14-megawatt diesel plant in Hetauda, and six-megawatt thermal plant in Biratnagar, and supply an additional 59 megawatt.
  • Reduce the current electricity leakage form 26 percent to 20 percent.
  • Encouraging the usage of CFL lamps, the customs duty in CFL import has been reduced from the current 15 percent to one percent.
  • Add an additional 150 megawatt to 200 megawatt by repairing the powerhouses and increasing their capacities, and also by controlling leakages.
  • Prioritize construction of one hydro project in each of the five development regions.
  • Encourage the private sector to produce power from rubbish.
  • Waive tax on private investors building new hydroelectric power plants.
  • Provide special security for investors and introduce laws to make it a crime to hamper energy construction projects, punishable by five years in prison.

Few comments:

  • While it is good to know that the government is getting serious about solving the power crisis, the latest moves are just an attempt to apply balm on a deep wound that needs a complete surgery of the whole structure/body. Grandiose plans had been put forth before as well, but in terms of implementation and action nothing substantial happened.
  • Why is there such low investment even when there is high return to investment in this sector? Simple answer: business unfriendly policies, red tapes, politicization of both NEA and licensing procedure, and corruption, among others reasons. The power market in Nepal is deeply distorted (in terms of price, politics and socio-economic dimensions).
  • Security of investment is a major concern among investors. Labor unions, politically-indoctrinated cadres, and affected villagers (who at least have genuine concerns about sharing outcomes and getting compensated for lost livelihoods and dwellings) are complicating security of investment.
  • The purchasing agreement between NEA and producers is another contentious issue. NEA has been offering an average rate of Rs 4.50 per unit for private developers. However, the developers are demanding that the NEA purchase electricity at Rs 6 per unit. The NEA is importing electricity from India at Rs 9.80 per unit, which is double the rate offered to the private sector. How come NEA is willing to offer higher price per unit on imports than from that generated from domestic sources? Why such discrimination against domestic producers?
  • About 26 hydro projects are ready to sign PPA but the developers are hesitating to negotiate purchase agreement at such a low price. Commercial banks have jacked up interest rates for hydropower projects to 13-14 percent, up from about 11 percent a few months ago. It means NEA should be offering higher price than the existing one to incentivize private sector to start investing in this underinvested sector. The late it is, the higher will be the cost of production as domestic bank loans will have higher interest rates due to their own problems, and construction machinery might be expensive as a result of increasing infrastructure investment in developing and emerging countries.
  • Promoting the use of CFL bulbs and solar panels can only take us so far. It might encourage efficiency and reduce usage of hydroelectricity marginally, but it won’t address the main issue, which is the structural problems in NEA and politicization in the whole hydropower sector. Similarly, increasing electricity prices will also not help the nation overcome the underlying problems of this sector. It might just help NEA cover some of the losses (almost Rs 19 billion as of now) and save it from going fully bankrupt.
  • The bottom line is that the power market in Nepal is deeply distorted, primarily due to excessive political interference and the corrupt, inefficient NEA, which has monopoly (and monopsony) over production, distribution, and purchase of electricity. Ironically, it is barred from adjusting electricity prices. The monopoly and monopsony powers of NEA should be axed. It should be given a supervisory/regulatory role only. Leave the rest to the private sector. The political interference in this sector should be outlawed.
  • Nepal needs an impartial independent energy commission (something like the CIAA) with competent human resources and equipped with the latest technology to save the country from further plunging into darkness. NEA should be made just a regulator/supervisor of the energy sector. Political interference in this sector should be constitutionally outlawed. This might help Nepal overcome some of the hurdles in the power sector, but not all.
  • Note that the lack of energy is one of the major binding constraints to economic activities in Nepal. For higher growth rate, enough power for households, enterprises and industries is a must.

Transplanting the Chinese model of growth

Here is a response from Justin Lin:


“We can learn many lessons from other countries’ experiences. But I try never to expect to transplant other countries’ models to China, because the specific opportunities in China will be different from other countries. And you know, I think we cannot directly transplant China’s models to any other country, including other middle-income countries or developing countries, even less so in high-income countries. But there’s always something that we can learn from other people. As the Confucian saying goes, if you walk with two people, you can always draw inspiration from the successful one and avoid the mistakes of the unsuccessful one.”


On replicating the process of structural transformation in China:


“One is that economic development in any country is a process of continuous technological innovation, industrial upgrading and diversification, and structural transformation. Any country starts with more than 85 percent of its population living on agriculture when its income level is low. To become a high-income country, the population living on agriculture will reduce down to 10 percent or less. This structural transformation is inevitable. In this process, a well-functioning market will be necessary for improving resource allocation. But at the same time, the market alone will not be enough.

For example, at the agrarian stage, farmers produce mostly for their own consumption. Only a small amount of produce is traded in the nearby market with people known to each other. Under such a situation, the need for infrastructure—such as roads for transportation—is limited, and a legal system for contract enforcement is not required. When the production moves to manufacturing, the economies of scale become larger, and producers will mostly produce for other people and not for themselves any more. The market range will expand, and trading becomes arms-length. To facilitate the transaction, roads are needed for transportation, and legal contract enforcements are needed. Capital for equipment investment and maintaining operations will also increase with the improvement of technology and the increase in the size of the market. So to make the change in the structure of production feasible, the infrastructure, legal system, and financial system also need to be changed accordingly.”


And, the role of the state:


“No matter how smart they are, individual entrepreneurs will not be able to carry out all those changes by themselves. You need to have a state to help them—to coordinate those kinds of changes. The problem I see is that, to be successful in economic development, one needs to understand the nature of this process, and to allow the market to play a fundamental role. But at the same time you need to have a government to facilitate the workings of the market, in order to make this kind of technological innovation, as well as structural transformation, feasible—to help carry it out smoothly and rapidly. This is one lesson that we can learn from China.”


Big is good: Firm heterogeneity and exports


This paper contributes to the more recent strand in the analysis of trade flows that uses data on exports of individual firms. In all countries of the world, relatively few firms participate in world trade, thus suggesting that besides country level barriers to trade, characteristics of a firm such as its size and productivity are relevant for participation in trade. Using firm level data, this study attempts to model and estimate the decision of Indian firms on their participation in trade. Firm heterogeneity is an important determinant of the decision to export. Exporting firms are significantly larger, more r&d-intensive, low wage-intensive, more productive and more profitable than non-exporting firms. The multinomial results reveal that the probability of survival of new firms in export markets is lower when compared to those which have been exporting in the previous years.


Here is a piece by Srinivasan and Archana 2011.

Saturday, March 26, 2011

Dangers of uncontrolled real estate plotting

Raping one of the hills in Budhanilkantha (Kathmandu Valley) with real estate plotting. Uncontrolled urbanization first, environment last priority for the builders. It is wrong. Period.


Friday, March 25, 2011

Nepalese industrialists and unions strike a deal

Good news! Seems like most of the issues related to industrial strike and labor-related industrial woes are being addressed in the latest deal between the three main trade unions and industrialists (represented by FNCCI). The deal will go into effect beginning March 15.

Main features of the deal:

  • No industrial strike for four years.
  • Increase in monthly salary and daily wage plus social security for workers. Remuneration per month has been increased by Rs 1500 (monthly salary increased by Rs 50 and dearness allowance by Rs 1450). This has increased minimum wage to Rs 6100 per month from Rs 4600. Daily wages have been increased to Rs 226 from Rs 190. Monthly remuneration has been increased by 32.6 percent and daily wage by 18.9 percent.
  • Employers and workers have also agreed to contribute 20 percent and 11 percent of their respective basic remunerations for implementing different social security schemes for workers.
  • The trade unions promised to extend their full cooperation to employers in curtailing the work force if any enterprise is forced to fully or partially close operations due to rise in labor cost or other adverse market conditions.
  • The workers have committed themselves to fully cooperate with the employers to increase industrial productivity.
  • They have also agreed not to take part in any political activities during working hours.

Most of the issues I raised in yesterday’s piece were addressed. Good for both FNCCI and unions. Let us just hope that the terms of the deal will be honored by both sides.

Union strikes and productivity in Nepal

My latest piece is about labor strikes in the industrial sector, its implication for workers and economy, and the productivity issues hinged with these increasing wage and allowance. My point is that if the unions want to industrialists to double minimum wage (instead of simply adjusting existing wage with inflation), they should also guarantee that labor productivity would also double. Else, why double wages when the industrial sector is losing competitiveness and is in a downturn?


Union strikes & productivity

The trade unions and industrialists, who are represented by Federation of Nepalese Chambers of Commerce and Industry (FNCCI), have locked horns over increasing salary and allowance of industrial sector workers. This has halted production, including in Hetauda Industrial Estate. Meanwhile, the industrialists brave enough to resist the unions’ diktat are being admonished and manhandled by party cadres and union activists. The Maoist-affiliated trade union, All Nepal Trade Union Federation (ANTUF) has been the most active and belligerent in the whole union versus industrialist drama. The other two trade unions that are complicating the matter are CPN (UML)-affiliated General Federation of Nepalese Trade Unions (GFONT) and Congress-affiliated Nepal Trade Union Congress (NTUC).

While the demands of the unions are valid as per the existing labor law, they are far too stretched in terms of the need and ability of firms to fulfill them. The scale of demand for wage increase is beyond the capacity of most of the firms, which are seeing razor thin profit margins and some are falling short of the minimum demand required to keep up their operations running. In such a situation, demanding extremely high wages that are inconsistent with inflation rate and without a guarantee of an increase in labor productivity shows foolhardiness of the unions, who seem to be motivated to go for strike not for labor welfare reasons, but for political ones.

The existing labor law has a provision that allows the government to revise minimum wage every two years by consulting with both workers and employers. Two years ago, the government had fixed monthly salary of Rs 4600 (Rs 3050 basic salary and Rs 1550 dearness allowance) and wage of Rs 190 per day. The usual trend is that minimum wage is adjusted with inflation. Since inflation is hovering around 10 percent, it would have been justified if the unions’ demanded for an increase in salary and allowances by the same percent. However, they have asked for an increase in daily wage by more than double the existing amount. The industrialists argue that they can increase salary by 23.7 percent only. But, the trade unions want monthly salary to be increased to Rs 10,000 and daily wage to Rs 400. Furthermore, they are demanding additional provisions like insurance, provident fund and social security of workers. So, employers and unions are at loggerheads over wage, allowance and labor welfare issues.

Given the state of our ailing industries, it is pretty much impossible for them to fulfill the unions’ demands. If the unions stick to their guns, then there is no prospect for amicable solution to industrial discord, which is not only reducing production, but also labor productivity and eroding competitiveness of domestic industries. If the industries close down, then it will be the poor workers who will lose jobs, not the union leaders who are basking on political blessing and stash of cash from membership fees and (forced) donation. The trade unions should first consider the state of our industries and economy before making wild demands and going on for a strike that will do nothing but decimate our ailing industrial strength, which is essential for bringing about structural transformation in the economy.

Allow me to highlight some of the issues the unions leaders and union members should keep in mind before heedlessly going on strike demanding something that cannot be fully fulfilled, at least right now.

First, demanding pay hike during prosperous industrial periods is reasonable. Unfortunately, this is not such a time. No firm will increase salary beyond the mandatory adjustment of basic wages with inflation if profits do not rise. Worse, for some companies that are just making break-even increasing salary without corresponding increase in sales revenue will mean losses. Going on strike and halting production will further decrease firm’s revenue, which means not only employment and wage freeze, but also layoffs. By vehemently going into strike, the unions are not only depriving their own members of a potential salary hike in the future, but also employment opportunities to aspiring employees. The tragic fate of the garment and textile industries is still fresh in our memories.

Second, the industrial sector is growing at a very slow pace. It registered negative growth rate (-0.2 percent) in 2009, down from a peak of 18.8 percent in 1992. Fortunately, it recovered slightly last year. Also, the industrial sector contributes just around 16 percent to our GDP and the manufacturing sector just about 6 percent. Against such a backdrop, how can the industries increase salary and allowance whose scale that is being demanded is not justified by the performance of any industrial variables right now? The willful act of the unions will further worsen the performance of the industrial sector.

Third, factors such as load-shedding, supply bottlenecks and donation campaigns are increasing cost of production of firms. It was reported that according to Small Factory Foundation Survey 2066, load-shedding has already forced closure of 41 percent of medium-scale factories. Furthermore, about twenty thousand workers lost jobs when five dozen big and small firms closed own in Birgunj-Pathalaiya industrial corridor of Parsa district. In such situation, without a decrease in cost of production, increase in profits is unimaginable. The pay hike (plus bonus and allowance) of workers depends on the rise in profits, which simply is not the case right now, thanks partly to destructive activities of the unions themselves. In fact, these factors have led to an increase in cost of production, eroded competitiveness both domestically and abroad, and led to a decrease in exports.

Fourth, low appropriability of private returns, i.e. the inability of the private sector to retain returns on investment, is taking its toll in industrial activities and economic growth. Poor property rights and slack contract enforcements engendered by the extralegal bullying of investors by the politically indoctrinated and militant youth wings and unions are falling heavy on the already ailing industrial sector. This is scaring away investors, both foreign and domestic. It will eventually cost jobs of the union members. The more destructive the unions get, the more it is going to cost the workers, industries and the country.

Fifth, remember that the militant activities of Young Communist League (YCL) severely crippled productive capacity and production in the industrial sector. It scared away foreign companies like Colgate Palmolive and shut down several garment firms. They not only harassed businessmen and terrorized business community by launching donation campaigns and confiscation of private property, but also illegally occupied industrial districts and disrupted production in several manufacturing plants in 2008. The very institution (private property) required for economic growth was handicapped by the YCL and Maoist-affiliated trade unions. In 2009, this was reflected in negative growth rate of industrial sector and a decline in annual GDP growth rate. Furthermore, net foreign direct investment inflow has been just 0.3 percent of GDP. The recent activities of the unions in the industrial sector bear the hallmark of the infamous industrial campaign launched by YCL in 2008. There is no benefit, but all loses in this endeavor.

Finally, can the unions guarantee that labor productivity will rise by the same proportion if salary and allowance are increased by the amount they are demanding? If not, then there is no point increasing salary and allowance beyond the one set by the minimum wage law and a simple adjustment with inflation. Note that, Nepal has the lowest labor productivity in South Asia. The labor unions should first convince the government and industrialists that labor productivity will increase if salary and allowance are increased. Then only their demands have logic. Else, there is every reason to speculate that all the drama staged by the unions has vested interests and are politically motivated.

[Published in Republica, March 24, 2011, p.6]


Thursday, March 24, 2011

The Japanese virtue


“In the face of calamity, a decent people has proved extremely resilient: no looting; very little complaining among the tsunami survivors. In Tokyo people queued patiently to meet their tax deadlines. Everywhere there was a calm determination to conjure a little order out of chaos. Volunteers have rushed to help. The country’s Self-Defence Forces, which dithered in response to the Kobe earthquake in 1995, have poured into the stricken area. Naoto Kan, the prime minister, who started the crisis with very low public support, has so far managed to keep a semblance of order in the country, despite a series of calamities that would challenge even the strongest of leaders. The government’s inept handling of the Kobe disaster did much to undermine Japan’s confidence in itself.”


Read this article in The Economist.

Wednesday, March 23, 2011

Nepal, India & China – growth and trade compared


China’s GDP growth rate has always been higher than that of Nepal’s. Since 2002 Indian growth rate started rising higher, but Nepal’s declined and then stayed below 5%. (Source: WDI)


GDP per capita of China and India is rising very fast. But, Nepal’s is pretty much stagnant (or rising at a very slow pace). (Source: WDI)


Since 1997 exports of goods and services (share of GDP) started to decline in the case of Nepal. Both China’s and India’s exports had been ever-increasing up until 2007, when the global financial crisis started and then followed by global economic crisis. China’s drop in exports was more pronounced than that of India’s after the economic crisis. Latest data show that exports of both the countries are picking up. (Source: WDI)


India is the most important exports destination for Nepalese exporters. Almost 64 percent of total merchandise goods are exported to India. Exports to both India and World declined after 2008. Exports to China is very low as of now. (Source: DOTS, IMF)


Imports from India accounts for almost 57 percent of total merchandise goods imports. Imports from China is picking up, thanks to cheap and competitive products. (Source: DOTS, IMF)


Trade deficit is ever-increasing. Trade deficit with India was around US$1.08 billion in 2009 and with the world (excluding India) US$1.04 billion. Trade deficit with China is increasing but below US$500 million. (Source: DOTS, IMF)


Nepal’s share of trade deficit (with respect to total trade deficit) is the highest with India, accounting for over 50 percent of total trade deficit. With China, it is around 15 percent of total trade deficit. (Source: DOTS, IMF)


Monday, March 21, 2011

Trade in services and human development

Shepherd and Pasadilla (2011) find that less restrictive services trade policies are associated with better human development outcomes across a range of sectors. They argue: “Appropriate services trade liberalization can therefore promote human development directly through improved outcomes, in addition to indirectly effects through the income channel.”

Usually, the impact of services liberalization impacts income, which in turn is assumed to promote human development. But, the authors isolate the direct connection between service sector restrictiveness and development and find: (i) the tension between service sector openness and human development outcomes are overstated; (ii) there is no systematic association between greater policy restrictiveness and better outcomes; and (iii)  open and efficient services sectors can help promote human development.

Thursday, March 17, 2011

Aid at a glance, Nepal (2006-2008)

Over the period 2007-08, humanitarian aid sector received the highest amount, followed by economic infrastructure & services, health and population and so on…. Here is an earlier post about the foreign aid in Nepal.

Wednesday, March 16, 2011

Tragedy in Japan

Donate for a noble cause and do you part in helping Japanese people overcome the misery brought by the earthquake and tsunami. Donate to The Nippon Foundation, an NGO working in a wide range of domestic and international activities, including health and welfare projects, educational and social issues, maritime development, and protection of the marine environment.

[FYI: My friend Shota Nakayasu is working in The Nippon Foundation.]

Political system and economic liberalization

Giuliano, Mishra and Spilimberg argue that economic reforms may scare politicians, but democracy and economic liberalization generally go hand in hand. Political liberalization and domestic financial, capital account, product markets (electricity and telecommunications), agriculture, and current account transactions tend to move together. But, look at political liberalization and trade. Trade seems to have increased, irrespective of political liberalization. Up until 1990, decrease in political liberalization actually boosted trade. Then political liberalization increased but trade performance continued increasing.


The bottom line is that democracy is good for structural reforms, but the reverse is not true—economic liberalization introduced by autocracies does not cause a move to democracy. Moreover, there is no foundation for politicians’ fear that voters will punish policymakers who implement financial sector reforms or reduce fiscal deficits.


Monday, March 14, 2011

The record of the Washington Consensus


For 30 years, Washington has been shopping a trade-not-aid based economic diplomacy across Latin America and beyond. According to what is generally known as the “Washington consensus”, the US has provided Latin America loans conditional on privatisation, deregulation and other forms of structural adjustment. More recently, what has been on offer are trade deals such as the US-Colombia Free Trade Agreement: access to the US market in exchange for similar conditions.

The 30-year record of the Washington consensus was abysmal for Latin America, which grew less than 1% per year in per capita terms during the period, in contrast with 2.6% during the period 1960-81. East Asia, on the other hand, which is known for its state-managed globalisation (most recently epitomised by China), has grown 6.7% per annum in per capita terms since 1981, actually up from 3.5% in that same period.

The signature trade treaty, of course, was the North American Free Trade Agreement (Nafta). Despite the fact that exports to the US increased sevenfold, per capita growth and employment have been lacklustre at best. Mexico probably gained about 600,000 jobs in the manufacturing sector since Nafta took effect, but the country lost at least 2m in agriculture, as cheap imports of corn and other commodities flooded the newly liberalised market.

This dismal economic record prompted citizens across the Americas to vote out supporters of this model in the 2000s. Growth has since picked up, largely from domestic demand, and exports to China and elsewhere in Asia.

Interestingly, the only significant card-carrying members of the Washington consensus left in Latin America are Mexico and Colombia.


More by Kevin Gallagher here.

Sunday, March 13, 2011

Going beyond Keynesianism to avoid another global crisis

High income countries are facing a “new normal” (a combination of low growth, high unemployment and low returns on investment). Some of the European countries are facing sovereign debt crisis and may require restructuring. Middle-income countries are experiencing short-term capital inflows, putting appreciation pressure on currency and equity and real estate markets prices. Surge of food, fuel and commodity prices is hurting the poor. With these economic problems what can be done to avoid another global crisis?

Justin Lin argues that “a global push for investment along the line of Keynesian stimulus is the key for a sustained global recovery; however, the stimulus needs to go beyond the traditional Keynesian investment.” But the problem lies in avoiding the Ricardian trap—a situation where the government spending fails to boost aggregate demand as people expect increases in taxes in the future (and save now) to pay for existing deficit that funds government spending. Lin suggest:


To avoid the Ricardian trap, it is important to go beyond conventional Keynesian stimulus of “digging a hole and paving a hole” by investing in projects which increase future productivity. So the investment will increase jobs and demands for capital goods now and increase the growth and government’s revenue in the future. The increase in revenue can pay back the cost of investment without increasing household’s future tax liability.


Krugman argues that this still misses the point:


It’s one thing to have an argument about whether consumers are perfectly rational and have perfect access to the capital markets; it’s another to have the big advocates of all that perfection not understand the implications of their own model.

So let me try this one more time.

Here’s what we agree on: if consumers have perfect foresight, live forever, have perfect access to capital markets, etc., then they will take into account the expected future burden of taxes to pay for government spending. If the government introduces a new program that will spend $100 billion a year forever, then taxes must ultimately go up by the present-value equivalent of $100 billion forever. Assume that consumers want to reduce consumption by the same amount every year to offset this tax burden; then consumer spending will fall by $100 billion per year to compensate, wiping out any expansionary effect of the government spending.

But suppose that the increase in government spending is temporary, not permanent — that it will increase spending by $100 billion per year for only 1 or 2 years, not forever. This clearly implies a lower future tax burden than $100 billion a year forever, and therefore implies a fall in consumer spending of less than $100 billion per year. So the spending program IS expansionary in this case, EVEN IF you have full Ricardian equivalence.


Friday, March 11, 2011

Are Nepal’s policies “mercantilist/economic nonsense”?

Here is my latest piece about Nepal’s Industrial Policy 2010, Trade Policy 2009, and Nepal Trade Integration Strategy (NTIS) 2010, and how they are trying to address trade related problems in Nepal. It is largely based on criticism of a paper authored by Malcolm Bosworth, who argues that unilateral trade liberalization with an increase in imports should be the main trade policy agenda of Nepal. I find this (bad) recommendation not suited to Nepal’s context. He argues that Nepal’s existing industrial and trade policies are “mercantilist/economic nonsense”. I will have detailed, specific comments on other arguments raised by Bosworth in later posts.


Mercantilist nonsense?

On February 28, 2011, the United Nations Economic and Social Commission for Asia and the Pacific (UNESCAP) organized a high level national policy dialogue on Nepal’s long-term direction in global and regional trade policy in Kathmandu. High level officials and experts working on trade related issues participated in the program, which was aimed at increasing national awareness and knowledge on “trade policy options to increase engagement in global and regional trade and derive benefits from such trade for development.”

The main highlight was a paper authored by Malcolm Bosworth, international consultant for the study and visiting senior research fellow at Crawford School of Economics & Government, Australian National University. By interacting with high level Nepali officials for few days and banking on inputs from a national consultant, Bosworth has written and fiercely advocated trade policy agendas for Nepal that are suicidal and largely detached from the dynamics and ground realities of the Nepali economy.

Let me touch upon a few of the many outrageous and ludicrous recommendations emanating from Bosworth’s paper. His main message is that unilateral trade liberalization, especially those geared toward increasing imports, should be the main trade policy agenda of Nepal. He argues that imports are as important as exports and the former has to be at least equally promoted as the latter. Furthermore, Bosworth maintains the current industrial and trade policies – which he says are “mercantilist nonsense”—are discriminatory because they promote one sector/product over the other, and seek market concessions abroad to increase exports. According to him, the increase in trade deficit is not a trade policy problem, but that associated with saving-investment imbalance, particularly domestic investment being higher than domestic saving. He recommends Nepal to eschew attempts to address trade and balance of payments (BoP) deficits using trade policy. To Bosworth Nepal Trade Integration Strategy (NTIS) 2010 is against the spirit of ‘welfare enhancing’ trade policy, which to him is unilateral liberalization to increase imports and non-discriminatory in terms of sector or product promotion.

Given Nepal’s structural problems (which are very likely not related to saving-investment imbalance), macroeconomic fragility and socioeconomic dynamics, Bosworth’s arguments defy rational economic logic. He assiduously extols the discredited “one-size-fits-all” policy recommendations and the Washington Consensus.

The reality is that unilateral trade liberalization will further worsen our BoP deficit and deepen macroeconomic instability, which might force Nepal to knock on the door of the IMF once again. Nepal already imports almost six times more than it exports. In 1976, trade deficit on goods and services was negative 3.4 percent of GDP, which swelled to negative 21 percent of GDP in 2009. This is simply unsustainable even in the medium-term. So far remittances have been partly neutralizing the effect of rising imports on overall BoP. But, this too is volatile because any disturbances in remittances inflow would further exacerbate the already fragile macroeconomic situation. Just two years ago when the global economic crisis led to a decline in growth rate of remittances inflow, our BoP became negative.

In such circumstances, prescribing a policy to increase imports by unilaterally liberalizing trade (and if necessary going beyond the rules set by the WTO to increase imports) is suicidal. Trade liberalization in unproductive imports—especially on luxury goods and branded items— will not increase welfare in a country where approximately 78 percent of the population lives below $2 a day. It would sensible if we liberalized further on capital goods imports, which would at least contribute to the productive capacity of our economy.

Pretty much every country in the world uses trade and industrial policies in one form or the other to aid their industries and export-oriented sectors. For Nepal, the domestic welfare emanating from trade and employment, and increase in purchasing power matters more than the welfare of citizens of other countries, i.e. we should not make ourselves worse off by making someone else better off. If possible, we could make ourselves better off by at least not making others worse off. But, this is idealistic given that in reality there are always tradeoffs. Our policymakers should not believe in the ideology that unilateral trade liberalization creates high welfare gains and less deadweight loss globally. Even if they did, the welfare from such liberalization is not equally distributed across and within nations. The Nepali government has responsibility to think about enhancing welfare of its citizens by playing by the rules set under international treaties, including the WTO.

If trade and industrial policies, that do not violate WTO rules, increase welfare of Nepali people, then there is nothing wrong in implementing them. An ultra-liberalization policy recommendation that tries to unsuccessfully debunk established evidence on the effectiveness of trade and industrial policies to abet domestic industries/specific sectors and products adds no value to the ongoing discussion about and efforts to mainstreaming our trade policy into overall economic policy.

It seems that rather than doing exhaustive stocktaking and writing a report based on reality, the analyst has tried to use a template of trade policy report used elsewhere. In fact, Bosworth forgets to replace “PNG Government” with “Government of Nepal” in the report (page 79, para 2). It is very likely that he inserted some discussion about Nepal’s trade situation by getting inputs from a national consultant and then projected it on top of a trade policy report already prepared for Papua New Guinea. Unsurprisingly, if you look at the presentations of the lead author and national consultant Dr Pushpa Raj Rajkarnikar, the latter seems to have comprehended and reflected Nepal’s trade situation and constraints more clearly than the former.

One appreciable aspect of Bosworth’s report is that he acknowledges that no degree of market opening abroad will boost Nepal’s exports if the supply-side constraints are not addressed. Supply-side constraints such as intermittent blockades, labor disputes and lack of adequate infrastructures (road transport and electricity) are eroding our competitiveness and preventing diversification of exports basket. That said, he again fails to read what Industrial Policy (IP) 2010, Trade Policy (TP) 2009 and NTIS 2010 are trying to address, i.e. supply side constraints in key sectors that have high chances of being successful domestically and abroad, and also have high socioeconomic benefits.

These policies are trying to facilitate structural transformation and diversification that Bosworth wrongly claims will only happen if trade is fully liberalized. When markets are riddled with coordination failures and information externalities structural transformation will not happen just by swinging the wand of liberalization. It only happens in ideal situation, which is hard to get by in Nepal. The recent literature on product space and the role of state in facilitating structural transformation is inconsistent with Bosworth’s recommendations. The government’s role as a facilitator in reducing coordination and information hurdles in order to accelerate economic activities is equally important in bringing about structural transformation as is the role of the private sector.

No doubt, Nepal’s existing policies have shortcomings in terms of achieving the aims that they are supposed to. But, they definitely are not “mercantilist/economic nonsense”. Making such outlandish, baseless claim shows the shortcoming of analysts, especially those ‘parachute analysts’, who drop in on Nepal for few days, interact with few officials and experts, and write reports based on templates. If their remuneration is counted as a part of Aid for Trade (AfT) initiative, then it is better not having them because the net value addition is probably negative. And, for now, promoting exports is more important than encouraging imports.


[Published in Republica, 2011-03-10, p.6]

Thursday, March 10, 2011

Country specific effects of fiscal stimulus

Ethan Ilzetzki, Enrique Mendoza, and Carlos Vegh (2011) analyze a quarterly dataset on government expenditures for 44 countries (20 high-income and 24 developing) from 1960 to 2007 and argue that the impact of government fiscal stimulus depends on key country characteristics:

  1. The output effect of an increase in government consumption is larger in industrial than in developing countries. Only after a lag of two to four quarters does output rise in response to an increase in government consumption, and the cumulative output response is not statistically different from zero. Furthermore, increases in government consumption are less persistent (dying out after approximately six quarters) in developing countries than in high-income countries. But, only in developing countries is the multiplier on government investment significantly higher than the multiplier on government consumption. Thus, the composition of expenditure may play an important role in assessing the effect of fiscal stimulus in developing countries.
  2. The fiscal multiplier is relatively large in economies operating under predetermined exchange rate but zero in economies operating under flexible exchange rates.The differences in the responses to increases in government consumption in countries with fixed and flexible exchange rate regimes are largely attributable to differences in the degree of monetary accommodation to fiscal shocks in these nations. The results imply that the central banks' response to fiscal shocks is crucial in assessing the size of fiscal multipliers.
  3. Fiscal multipliers in open economies are lower than in closed economies. Economies that are relatively closed, whether because of trade barriers or larger internal markets, have long-run multipliers of around 1.3 to 1.4, but relatively open economies have negative multipliers.
  4. Fiscal multipliers in high-debt countries are also zero. When the outstanding debt of the central government exceeds 60 percent of GDP, the fiscal multiplier is not statistically different from zero on impact and it is negative in the long run.

This might mean that in a least developed country like Nepal, the government can do a lot to jack up growth rate. First, government investment has to be high as consumption level is already high in Nepal. This means investment in infrastructures, education, health and research & technology. Second, since Nepal has a fixed exchange rate with India, and if the central bank rolls out monetary policy that is consistent with fiscal stimulus, the resulting fiscal multiplier could be large. Also, given the idle resources and massive unemployment, fiscal stimulus (with good governance on the use of money) would produce sizable impact on the economy.

About, high-debt argument, Krugman disagrees with the 60 percent of GDP threshold (Reinhart-Rogoff argue that debt over 90 percent of GDP leads to drastically slower growth. Krugman dismisses this idea.)

Tuesday, March 8, 2011

How to ensure stable growth in post-crisis Asia?

By raising consumption and investment or reorienting investment from tradable to nontradable sectors. These changes in investment could be facilitated by financial reforms that enhance domestically oriented firm’s access to credit, stronger incentives for corporate restructuring, policies to bolster the business climate and reduce uncertainty, and by improvements in infrastructure that raise the returns to private investment.

More on this on a paper by Nabar and Sayed 2011.

Monday, March 7, 2011

Higher food prices are here to stay

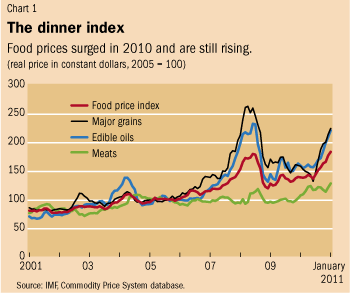
Thomas Helbling and Shaun Roache (2011) argue that higher food prices are here to stay not because of weather factors, but due to the ongoing structural change in international food markets. The weather-related supply shocks will normalize after production increases during favorable weather conditions. But, what will be hard to change is the fact that consumers in emerging and developing countries are getting richer and changing their diet, particularly eating more high-protein foods such as meat, dairy products, edible oils, fruits and vegetables, and see food. These products are more income elastic than staple grains. So, supply adjustment to the structural increases in demand for major food commodities will take more time than adjustments related to weather-related supply shocks. Improved technology and higher yield growth could compensate for the such scarcity in the long term. But, for the short term, higher food prices could find a new normal that is higher than previous thought.

What is causing the rise in food prices?

  • Food is not traded as extensively and readily as manufactured goods, because of protectionist agricultural policies. Since most food is not traded, international food prices are only one determinant of domestic food inflation.
  • Structural changes in diet in emerging and developing countries, i.e. more consumption of meat, and more demand for animal feed to rear cattle.
  • Increasing use of food grains to produce biofuels. High oil prices and policy support (for production of biofuels) have boosted demand for biofuels. In 2010, the production of corn-based ethanol absorbed 15 percent of global corn crop. Meanwhile, high oil prices directly increase cost of production of food because fuel is used to produce inputs such as fertilizers.
  • Over the past decade, global productivity growth (the amount of crop produced per hectare) has fallen for rice and wheat compared with the 1980s and 1990s. Ceteris paribus, less productivity growth means higher prices. For farmers, average prices have to increase to provide enough incentives for increased supply. But, with lower yield growth, production increases have to come from using more land (higher acreage).  Meanwhile, low yield growth and limited land availability amid rapid demand growth could lead to shifts in international trade patterns.

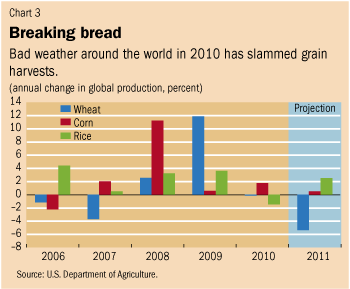
  • Food prices are pushed up due to a series of weather-related supply shocks since mid-2010. Droughts and wildfires decreased wheat production in Russia, Ukraine, and Kazakhstan; a hot and wet summer led to lower-than-expected corn harvest in the US; and La Nina weather episodes hit rice production in Asia. Worse, shortfall in production led to the imposition of grain export restrictions in Russia and Ukraine. Patterns of protectionist trade policy has been observed after the supply shocks.
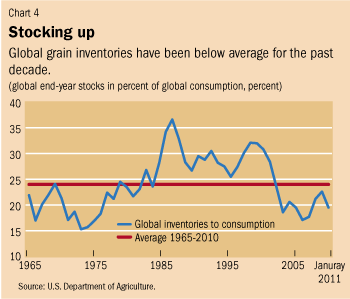
  • Stock-use ratio (stocks relative to consumption) are low, causing food price volatility. Reluctant inventory holders withhold release of grains due to fear of future shortages, thus affecting food supply and prices in the market.

Friday, March 4, 2011

Public investment and economic growth

Public investment on infrastructures, education and health are prominently featured in developing country’s fiscal budget. But, how fruitful are these investments? Does increase in public investment leads to growth? The World Bank (2007) argued that public spending on infrastructure, education, and health yields positive effects on growth. Similarly, the Commission on Growth and Development (2008) noted that fast-growing countries are characterized by high public investment, defined as 7 percent of gross domestic product (GDP) or more.

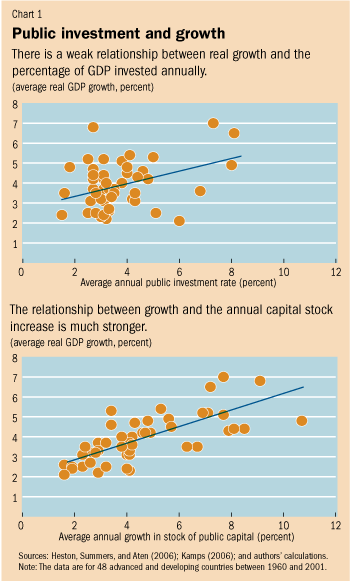
Recently, Arslanalp, Bornhorst and Gupta (2010) studied the impact of public investment on economic growth for 48 advanced and developing economies during 1960–2001. They found that public investment generally has a positive impact on growth. Specifically, on average, GDP grew by 3.4 percent in advanced economies and 4.4 percent—1 percentage point more—in developing economies from 1960 to 2000. Here they summarize the main findings of their paper. They argue that the mixed result is resulting because most of the studies look at investment rate (% of GDP devoted to capital stock). However, the authors argue that the rate of growth of capital stock should be the focus. The capital stock—together with other production factors, such as labor and technology—determines an economy’s production potential. The investment flow in any given period, by contrast, determines how much capital is accumulated and therefore available for production in the subsequent period.

Tackling the issue of depreciation:


The value of the capital stock is calculated using the perpetual inventory method. In this method, the net capital stock—public and private—is determined by adding gross investment flows from the current period to the depreciated capital stock of the previous period. As a result, the stock data account for the wear and tear on assets.The choice of depreciation rates presents perhaps the biggest challenge to tallying the capital stock data—mainly because country-specific estimates of depreciation rates (how much of the capital stock is used up in a period) are typically not available. Instead of applying a uniform rate to all countries, we differentiate the assumed depreciation by groups of countries reflecting different types of assets typically available in those countries. These assets have different life spans, resulting in different depreciation rates. For example, concrete structures are typically estimated to last longer than assets related to technology, whose investment life may be only a few years. As countries become richer, the share of assets with shorter life spans rises, thereby raising the overall depreciation rate.

The U.S. Bureau of Economic Analysis estimates that overall depreciation rates for public capital in the United States were about 2½ percent per year in 1960 and 4 percent in 2001 (Bureau of Economic Analysis, 2010). We extended this assumption to the public capital stock estimates for all advanced economies in our sample. For middle-income countries, we used a time-varying profile in which the depreciation rate starts at 2½ percent in 1960 and reaches 3½ percent by 2001. We assumed a constant rate of depreciation of 2½ percent for low-income countries throughout the sample period. We confirmed our findings using other plausible depreciation rates.


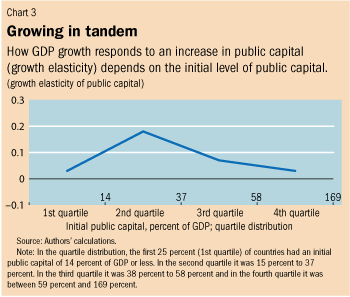
The correlation between average public capital growth and average GDP growth is much higher than between the average public investment rate and GDP growth.


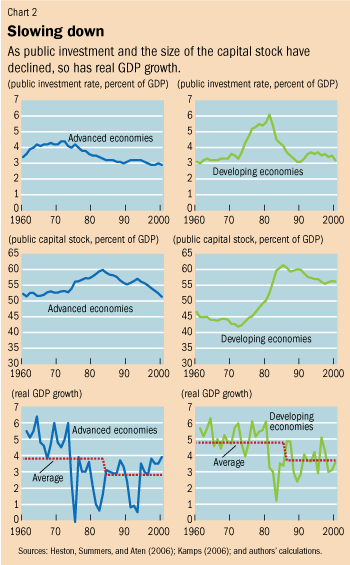
It shows that the public investment rate has been on a downward trend since the early 1970s in advanced economies. In contrast, the public investment rate increased significantly in developing countries in the 1970s, although it returned to its earlier levels in the 1980s. Public capital stock, as a percent of GDP, peaked for advanced economies in 1983 and for developing economies in 1985. The peak levels were 60 percent of GDP for advanced economies and 61 percent of GDP for developing economies.


Thursday, March 3, 2011

How will India’s fiscal budget affect Nepali economy?

The Indian Finance Minister Pranab Mukherjee presented to the Indian parliament a fiscal budget of around US$278.38 billion for the next fiscal yar (April 1, 2011- March 31, 2012). Since Nepal shares an open border with India and has also pegged its currency with Indian rupee, the fiscal policies (both expenditure and tax) of India affect the Nepali economy as well. Here is a list of issues officials at the finance ministry in Nepal will have to grapple with while rolling out next fiscal year’s budget (July 16, 2011-July 15, 2012).

  • Inflation in India (expected at 5%) will affect price levels in Nepal. The increase in purchasing power (indirectly) due to subsidies and indexing MGNREGA wages (IRs 100 in real terms) to consumer price index will not help to decrease prices of essential items; it will either maintain status quo or an increase in prices. In real terms, the Indian consumers would not lose that much. But, Nepali consumers will lose (both in real and nominal terms). Also, purchasing power of average families will increase by over IRs 2000 due to upping of personal income tax exemption (at IRS 180,000). The nominal increase in demand will further increase demand in the Indian market. If it affect general prices, then Nepal will also bear the brunt. But, if it increases real expenditure on sectors with idle resources (including travel and recreation), then Nepal might benefit.
  • The increase in services tax (hotel, airfares, branded products, etc. of 10 percent) might make Nepali destinations relatively cheaper. However, nothing concrete can be said on this regards as it all depends on relative (cost of production) prices on the sectors concerned between the two countries.
  • Indian farm and fertilizer subsides will affect Nepali agricultural prices as Nepal imports a lot of food products from India. Meanwhile, Nepal has agreed to eliminate Agricultural Reform Fee (ARF) for Indian agro-good, making Indian agro products further cheaper in the Nepali market. It might make some agro-products cheaper in the product market. But, it might also erode our agriculture production and employment (especially that of commercial ones).
  • The decision to impose higher tariff on gold will further widen gold price differential between Nepal and India. Nepal will have to increase tariff on gold to discourage gold smuggling to India and to not let balance of payments deficit further widen.
  • Similarly, prices of fuel have not been revised. So, some price differential on the two sides of the border is very likely, leading siphoning off of fuel from Nepal to India. It will not only affect domestic availability of fuel but also widen trade deficit as Nepal buys fuel at international prices from IOC and sells it in the domestic market at a little deflated price.

I will add more on later posts.

Trade and Labor Market Outcomes


This paper reviews a new framework for analyzing the interrelationship between inequality, unemployment, labor market frictions, and foreign trade. This framework emphasizes firm heterogeneity and search and matching frictions in labor markets. It implies that the opening of trade may raise inequality and unemployment, but always raises welfare. Unilateral reductions in labor market frictions increase a country's welfare, can raise or reduce its unemployment rate, yet always hurt the country's trade partner. Unemployment benefits can alleviate the distortions in a country's labor market in some cases but not in others, but they can never implement the constrained Pareto optimal allocation. We characterize the set of optimal policies, which require interventions in product and labor markets.


Full paper by Helpman, Itskhoki, and Redding (2011) here.

Tuesday, March 1, 2011

Highlights of India’s FY 2011-12 budget

Highlights of budget for next fiscal year (April 1, 2011- March 31,2012) presented by Indian Finance Minister Pranab Mukherjee on Monday to the parliament. Budget summary sourced from Reuters.

At US$ 1= IRs 45.18 exchange rate [100 crore = 1 billion], total estimated expenditure equals to US$ 278.38 billion, total estimated revenue (tax and non-tax) equals to US$ 174.83 billion; and total deficit borrowing (recovery of loans, other receipts and borrowing and other liabilities) equals to US$ 103.54 billion. Total estimated GDP for FY 2011-12 is US$ 1.99 trillion.

BORROWING

  • Gross market borrowing for 2011-12 seen at 4.17 trillion rupees
  • Net market borrowing for 2011-12 seen at 3.43 trillion rupees
  • Revised gross market borrowing for 2010-11 at 4.47 trillion rupees

FISCAL DEFICIT

  • Fiscal deficit seen at 5.1 percent of GDP in 2010-11
  • Fiscal deficit seen at 4.6 percent of GDP in 2011-12
  • Fiscal deficit seen at 4.1 percent of GDP in 2012-13
  • Fiscal deficit seen at 3.5 percent of GDP in 2013-14

SPENDING

  • Total expenditure in 2011-12 seen at 12.58 trillion rupees
  • Plan expenditure seen at 4.41 trillion rupees in 2011-12, up 18.3 percent

REVENUE

  • Gross tax receipts seen at 9.32 trillion rupees in 2011-12
  • Corporate tax receipts seen at 3.6 trillion rupees in 2011-12
  • Tax-to-GDP ratio seen at 10.4 percent in 2011-12; seen at 10.8 percent in 2012-13
  • Customs revenue seen at 1.52 trillion rupees in 2011-12
  • Factory gate duties seen at 1.64 trillion rupees in 2011-12
  • Non-tax revenue seen at 1.25 trillion rupees in 2011-12
  • Service tax receipts seen at 820 billion rupees in 2011-12
  • Telecoms fees, auction of broadband spectrum to raise 296.5 billion rupees in 2011-12

SUBSIDIES

  • Subsidy bill in 2011-12 seen at 1.44 trillion rupees
  • Food subsidy bill in 2011-12 seen at 605.7 billion rupees
  • Revised food subsidy bill for 2010-11 at 606 billion rupees
  • Fertiliser subsidy bill in 2011-12 seen at 500 billion rupees
  • Revised fertiliser subsidy bill for 2010-11 at 550 billion rupees
  • Petroleum subsidy bill in 2011-12 seen at 236.4 billion rupees
  • Revised petroleum subsidy bill in 2010-11 at 384 billion rupees
  • State-run oil retailers to be provided with 200 billion rupee cash subsidy in 2011-12

GROWTH, INFLATION EXPECTATIONS

  • Inflation seen at 5 percent in 2011-12
  • Economy expected to grow at 9 percent in 2012, plus or minus 0.25 percent

TAXES

  • Standard rate of excise duty held at 10 percent
  • Service tax rate held at 10 percent
  • Scope of service tax to be widened
  • Minimum alternate tax raised to 18.5 percent from 18 percent
  • Iron ore export duty raised to 20 percent
  • Personal income tax exemption limit raised to 180,000 rupees

DISINVESTMENT

  • Disinvestment in 2011-12 seen at 400 billion rupees

POLICY REFORMS

  • Food security bill to be introduced this year
  • Foreign direct investment policy to be liberalised further * Infrastructure debt funds to be created
  • Infrastructure growth to be boosted with tax-free bonds of 300 billion rupees
  • Foreign institutional investor limit in 5-year corporate bonds for investment in infrastructure to be raised by $20 billion
  • To permit Securities and Exchange Board of India (SEBI) registered mutual funds to access subscriptions from foreign investments
  • Public debt bill to be introduced in parliament soon

SECTOR SPENDING

  • Infrastructure allocation increased by 23.3 percent to 2.14 trillion rupees in 2011-12
  • To allocate more than 1.64 trillion rupees to defence sector in 2011-12
  • Corpus of rural infrastructure development fund raised to 180 billion rupees in 2011-12
  • To provide 201.5 billion rupees capital infusion in state-run banks in 2011-12
  • To allocate 520.5 billion rupees for the education sector
  • To raise health sector allocation to 267.6 billion rupees
  • Mahatma Gandhi National Rural Employment Guarantee Scheme wage rates linked to consumer price index; will rise from existing Rs.100 per day.

AGRICULTURE

  • To focus on removing supply bottlenecks in the food sector
  • To raise credit flow target to agriculture sector to 4.75 trillion rupees
  • Give 3 percent interest subsidy to farmers in 2011-12
  • Cold storage chains to be given infrastructure status
  • To provide 3 billion rupees for 60,000 hectares under palm oil plantation
  • Actively considering new fertiliser policy for urea

MAJOR CONCERNS

  • Food inflation remains a concern
  • Current account deficit situation poses some concern
  • Must ensure private investment is sustained
  • "Certain events in the past few months may have created an impression of drift in governance and a gap in public accountability ... such an impression is misplaced."
  • Corruption is a problem, must fight it collectively