Friday, December 18, 2015

The quality of politicians and economic growth

The quality of growth depends on the quality of politicians you elect! 

That’s the main point of a working paper by Prakash, Rockmore and Uppal, who summarized their findings in a VoxEU column. Apparently, the findings are based on their working papers, but a link to it is not provided yet in the column. Anyway, intuitively the results do not seem surprising if you look at the developing countries that have weak institutions and the same politicians or their associates being elected repeatedly.

Excerpts from the article:


Despite a history of widely contested and transparent elections, and the presence of a vibrant and open media, India is electing an increasing number of politicians facing criminal charges. This share has risen from 24% of members of the Indian Parliament in 2004 to 34% in 2014 (New York Times 2014). While the election of criminally accused candidates to public office is concerning in any context, it is especially so for India. Large quantities of funds are distributed by the government through a wide variety of interventions and programmes, which have been plagued by costly scandals with losses in the hundreds of billions of dollars (Sukhtankar and Vaishnav 2015). A severely understaffed judiciary and police force, resulting in an extremely slow judicial system, exacerbate this problem. Taken together, these realities create a context in which an influx of criminally accused politicians could be especially costly for an economy.
Using information on the charges filed against candidates, we estimate the causal effect of electing criminally accused politicians to the State Assembly on the subsequent economic activity in their constituency. In particular, we focus on elections in 20 Indian states during the 2004 to 2008 period. Since economic data are not systematically available for constituencies, we rely on satellite data on the intensity of night-lights. These data have been increasingly used to proxy for economic growth, as studies find a strong relationship between GDP and night-light intensity at the sub-national level (Bleakley and Lin 2012, Henderson et al. 2012, Hodler and Rashky 2014, Storeygard 2014). 
[…]We find that the election of an accused politician leads, on average, to roughly a 22 percentage point lower yearly growth in the intensity of night lights. Based on conversions between GDP and night lights, this is roughly 5.61% to 5.86% GDP growth per year (as compared to the 6% otherwise). Overall, these results highlight the high aggregate economic costs of electing lower quality politicians (i.e. criminally accused) and point to likely significant individual costs in foregone access to public services.
[…]We find a strong negative effect of electing politicians accused of financial or serious charges. In contrast, politicians who are only accused of either non-financial or non-serious charges do not have a negative impact on economic outcomes. We also find that the size of the negative effect increases with the number of underlying accusations. These results show that the specific accusations and charges matter, and the costs increase with the severity of the accusation.
[…]When we examine the accumulation of these costs, we find that the effects only appear in the later years of the politician’s term. There is no apparent effect in the initial years. We believe that this is explained by the need for politicians to collaborate with local bureaucrats to engage in corrupt activity (Iyer and Mani 2012). After elections, bureaucrats frequently change positions so it takes a certain amount of time for corruption politicians and bureaucrats to identify each other. Additionally, the effects of neglected public infrastructure, such as roads, may take some time to slow down economic activity.
[…]we find that the number of incomplete road projects increases in constituencies represented by criminally accused candidates. Once again, the negative impact is driven by candidates who are accused of serious and financial charges throughout India.
[…]we convert our estimates into rough measures of GDP costs and find estimates ranging from 2.3 to 6.5 percentage point lower GDP growth per year for our main result. 
[…]instead of focusing on the overall outcomes (such as the delivery of public goods), voters focus on whether politicians can deliver targeted transfers to their specific group or caste. Not only are voters perhaps more likely to overlook accusations, but these accusations might serve as a signal of the politician's willingness to use the office to reward fellow group members (Chauchard 2014, Wade 1985).

Friday, December 11, 2015

For Japan, raising inflation target and increasing wages by 5-10 percent may be better

While some countries are grappling with high inflation, Japan (and in relative terms the developed countries) are struggling with persistent low prices, stagnating wages, low economic growth despite massive monetary stimulus for the last few years, and unemployment. Monetary easing is considered more palatable compared to fiscal stimulus because of the latter's impact on fiscal deficit and public debt. But then when monetary sector has little traction on the real sector during these depressed times (low demand as well as cautious credit flows), the most effective antidote to persistently low prices and growth is fiscal stimulus as the multiplier tends to be higher (in the case of government spending in productivity-enhancing investment projects). So, when GDP grows (faster than fiscal deficit and public debt growth), things may look a little less scary. In some countries this requires policies to deliberately raise inflation, which may eventually stabilize fiscal situation!

Here is a nice piece by Blanchard and Posen of the Peterson Institute for International Economics (PIIE) on what Japan should be doing now to prop up prices and then GDP growth. In a nut shell, Japan may consider raising wages by 5-10% (wage growth has been pretty much insignificant for many years in Japan and it follows the inflation rate).

Excerpts from the article published in FT:


Japan needs inflation, and more inflation than the 0.5 percent achieved with its quantitative easing (QE) program. The need is not for the usual countercyclical reasons, even if the economy is flirting with technical recession. Rather, the country needs meaningful positive inflation for reasons of fiscal stability.
[...]Together, Abenomics and the Bank of Japan's commitment to a 2 percent inflation target were intended to encourage a virtuous cycle from positive inflation to wage increases to greater consumption and so on. The central bank's large-scale asset purchases (Y80 trillion a month of Japanese government bonds) have helped: Inflation has fluctuated between 0.5 and 1.0 percent, an improvement over the deflation of the preceding two decades, and the yen has declined in two stages to Y120-plus to the dollar.
But that decline has proved insufficient to start an inflation cycle in the face of falling energy prices and the recent Chinese slowdown. Nominal wages rose only a little more than 1 percent in 2014 and 2015. For the average Japanese investor and consumer, inflation expectations have not budged.
Japan needs to jump-start a wage-price spiral of the sort feared from the 1970s, but that Abenomics rightly aspired to after 20 years of deflation. Such a cycle should be started by increasing nominal wages by 5 to 10 percent in 2016. Tripartite bargaining is practiced in Japan—i.e., annual nationwide wage negotiations for the unionized part of the Japanese labor force with government participation. A third of the country's workers are covered by these bargains, and many more (including management) have their wage adjustments set accordingly. Even part-time worker pay is correlated with this process. Such bargaining with government input can push wages up, just as in the past it has kept them down. In the 2014 and 2015 wage rounds, the Abe administration publicly advocated a rise in wages but did little else.
[...]The point is not to redistribute income from business to labor. If anything, employers and other price setters should be encouraged to pass on the increased costs from wages to consumer prices and try to maintain their profit margins. The Bank of Japan should maintain QE to accommodate this general price and wage increase until the cycle takes hold over a three-year period. This means replacing the current 2 percent inflation target with something much higher—such as 5 to 10 percent—for several years. This would be unlikely to cause accelerating double-digit inflation, but if it did, the Bank of Japan could easily stop that spiral. In parallel, the central bank should also aim for an exchange rate depreciation proportional to inflation, so as to keep the real exchange rate roughly constant.


Monday, November 16, 2015

Earthquake and Blockade: A wrecked Nepalese economy

Earthquake and economy

The catastrophic 7.8 magnitude earthquake on 25 April and subsequent aftershocks (two of them very strong) crippled the economy on all fronts: agricultural output as well as agricultural land was lost, and industrial and services sectors struggled to keep operation open amidst widespread disruption of production and distribution networks, especially on the main demand centers (urban areas including Kathmandu) and trade routes with China. Consequently, GDP growth came tumbling down to 3.0% from an expected 4.6% in FY2015 (unfavorable monsoon had already lowered GDP growth from 5.1% in FY2014). Meanwhile, the subdued market prices during the first three quarters more than offset the increase in prices of goods and services post-earthquake (which struck in the tenth month of FY2015), leading to inflation of about 7.2%.


External sector strengthened as lower import growth and higher remittance inflows immediately after the earthquake increased current account balance and balance of payments surpluses (5.1% of GDP and 6.8% of GDP, respectively). Fiscal performance remained dismal as estimated actual capital spending was just about 70% of planned capital spending, and revenue mobilization grew at 13.8% against 20.5% in FY2014.  Capital spending remains woefully low at around 3.5 to 4.0% of GDP. The low expenditure performance and relatively high revenue mobilization led to a fiscal deficit of around 0.2% of GDP (with primary surplus of about 1.6% of GDP in FY2015). Migration slowed down immediately after the earthquake, unprecedented scale of international assistance (primarily led by India together with PRC and the US) was mobilized, and the affected folks struggled to normalize household activity. About a million people fell below the poverty line.

The government estimated that the recovery cost would amount to about $6.7 billion (half of it needed for housing and human settlement), almost a quarter of FY2015 GDP. The international community pledged about $4 billion to finance post-earthquake rehabilitation and reconstruction (which is more than the share to be shouldered by the public sector). So, money was not an issue. The capacity to spend it effectively was. To give momentum to this, the government focused FY2016 budget (and monetary policy) on “building back better” and faster. To this end, an ordinance was promulgated to establish National Reconstruction Authority. The ordinance never made it to the parliament within 30 days and hence its life ended drastically. A bill on NRA is pending in the parliament. It has become a victim of political infighting, delaying post-earthquake reconstruction (urgently needed for short-term recovery and for long-term preparedness in this seismically active country). Initial euphoria about post-earthquake reconstruction has dampened. Pledged funds have remained idle (some may get cancelled if there is no progress), affected folks are still struggling to get by normal life, economy is weaker than before, and the lack of direction on reconstruction has raised frustration levels and the attrition of labor force. Meanwhile, political leadership has lost the sense urgency, hastened promulgation of constitution disgruntling some section of the population, and is still engaged in political infighting. Bureaucracy remains confused and increasingly looking for guidance from political leadership even in minor matters.


Now, that’s the story about post-earthquake economic tragedy triggered by the natural disaster that affected the upper and middle belts of western and mid-western administrative regions.


Blockade and economy

Enter the crisis in the Terai region and the debilitating impact on the economy. The crisis was brewing prior to the promulgation of the constitution as some Madhesh-based political parties objected to some provisions included in the draft constitution, which was passed by an overwhelming majority in the Constitution Assembly. The main point was the demarcation of federal states in the Terai region. With no flexibility (both sides) shown to settle the issue politically, the discomfort, disdain (not all but among some) and alienation increased. Consequently, protests and the state’s reaction to protesters (at times excessive on both sides) intensified. India came into the picture to influence changes to the constitution and many analysts allege that it is imposing an ‘unofficial blockade’ on the borders. Supporters of protesting parties picketed the border areas, virtually halting the movement of goods and services. What, how, who, when, etc narrative differ based on the ideological leaning (passion is overpowering reason and cool-headedness) of analysts, consultants, journalists, lawyers, politicians, etc (however ‘independent’ they are).

Anyway, the focus here is economy. Since Nepal is a landlocked country and trade with India accounts for about 60% of imports and exports (plus it provides access to its ports), the activities on the border have severely crippled the economy, which was already hamstrung by the impact of the earthquake and the government’s and the bureaucracy’s inability to initiate rehabilitation and reconstruction swiftly.

The supply disruptions (some allege it as official/unofficial blockade by India) have affected pretty much every economic activity. The Terai belt is considered an important agricultural and industrial hub, and it has all the major custom points along the major border crossings with India. The Terai region accounts for about 51% of agricultural output, 52% of industrial output and 40% of services output. The population of Terai (quite diverse in terms of ethnicity, class, language, income, vocation, etc) is about 50% of total population.

The subnormal monsoon was already affecting plantation and hence potential agricultural output. The disruption to household agricultural activities and shortage of chemical fertilizers along with uncertainty over timely harvesting have dented the outlook for agricultural output. Industrial activity has come to a grinding halt. Mining and quarrying, and construction works have not progressed much due to the delay in post-earthquake reconstruction. The shortage of supply of raw materials or intermediate goods (including petroleum fuel and LPG cooking gas) along with the closure of manufacturing plants have affected manufacturing and construction activities. Industrial sector will most probably grow at a negative rate.

Meanwhile, services sector, which is largely based on remittance-financed imported goods, has been severely crippled. Wholesale and retail trade (which is by far one of the most important and stable drivers of growth in addition to agricultural output) has been severely disrupted. Hotels and restaurants are struggling to cope with the acute shortage of cooking gas and diesel (fires up generator during load-shedding hours). Tourist arrival has plummeted. Real estate and associated businesses are in doldrums. Education institutions are shut down or are partially operational. Hospitals are running out of emergency as well as normal items. Services sector will also most likely grow at a negative rate.


So, the economic outlook looks very grim. As of now (with uncertainty over the resolution of the crisis), the growth rate in FY2016 will most likely be negative (it hasn’t happened so far and the lowest growth [0.2%] was registered in FY2002 immediately after the intensification of Maoist insurgency; services growth was negative 1.8%). My estimate is that GDP growth will plunge to around negative 0.8% in FY2016. Importantly, subject to the longevity of ongoing supply and production disruptions, the effect of the disruption to and dislocation of economic activities as a result of the earthquake and subsequently the crisis in Terai (including blockade) are going to linger on for the next few years if the response from the government is not swift (after the resolution of Terai crisis, which lets hope will happen sooner). The rate of exit from the labor force will be high and potentially migration for overseas work will increase. The existing growth rate is already too low. With the weak state of infrastructure supply and institutional fundamentals, the economic and employment potentials are further constricted. Not a good sign to bring back production and economic activities back to normal!

The food as well as non-food inflationary pressures will likely shoot up overall inflation above 10% and it might linger at higher levels in the following year(s). On the external front, trade deficit will come down along with the plunge in both exports and imports. Remittance inflows may remain strong and hence current account surplus may be remain at high levels. Lower lending compared to deposit will likely lead to liquidity surplus. Lower expenditure and lower revenue growths may result in not much deterioration of fiscal position. However, lower expenditure as well as lower revenue growth will mean some of the fiscal targets will be beyond the reach for this year and the next. Lets hope FY2017 will be better!

In a nutshell, tough times for the economy, the poor and the middle class throughout the country!

Finally, the issue about what needs to be done?
  • Economic outlook will continue to be bleak if the supply disruptions continue. Speeches about self-sufficiency right now are useless. The country cannot simply become self-sufficient [self-reliant(?)] in food and energy in one or three years. Hydroelectricity production is not going to be sufficient over the medium term (within 5 years). While some are awaiting repairs following the earthquake, others are struggling to accelerate construction. However, the issue here is of raw materials/intermediate goods, which need to be imported (ranging from fuel to nuts and bolts and cement to heavy equipment). With the blockade in place, all construction work is already delayed by many months because it will take more time to restore pre-crisis (plus pre-earthquake) pace of work, which will partially depend on the clearance at the border and transportation of inputs to construction sites. So, resolve the Terai issue pronto to rescue the economy. No other way out!
  • Rather than giving pompous statement about self-sufficiency and ending load-shedding, the government should bring out a time-bound strategy on how to achieve them. This would require taking tough decisions: taming unruly labor unions and interest groups hindering reform, enhancing productivity of workers, better community relations (think of obstruction caused due to the demand for shares by locals, etc), expedited construction of transmission and distribution lines (these have been trailing behind hydroelectricity construction affecting expected return on some of the investment), reforming NEA and NOC (and a slew of other moribund public enterprises), promoting the use of alternative sources of energy, updating the relevant Acts and implementing them in earnest, creating stable institutions and manning them with competent human resources, etc. The list is long and very challenging to do over the medium term given the will of political leaders and interest groups rallying behind them. See this piece on why Nepal is poor?
  • Enough has been said already about National Reconstruction Authority. Just pass the Act, appoint a competent CEO, bring all implementing ministries on board and do the reconstruction within a stipulated timeframe.
  • Boost public sector’s capacity to spend money. The availability of funds in the short-term is not an issue. The country is running a primary surplus already. Just use the funds wisely and in an accelerated way in productivity-enhancing investments (physical and social infrastructure).
  • Revitalize the private sector and provide it with adequate incentives to focus on domestic production as opposed to trading of imported goods. Here also comes in the strategy to diversify the production base to reduce dependence on a single country for export and import. Upgrade customs points located in the northern and southern borders. Promote value chain development (intra and inter sector) and facilitate supply chains.
  • Good governance is very important in all of these. Enough has already been said about it. Time to introspect and do the right thing.

Friday, October 30, 2015

Poverty in Nepal and South Asia based on $1.90 a day poverty line

The World Bank recently updated its global poverty line, which is now re-estimated at $1.90 a day, up from $1.25 a day earlier. Accordingly, poverty estimates for all countries have been revised, mostly downward.

Nepal’s absolute poverty at $1.90 a day stood at 14.9% in 2010, a sharp decrease from 47.1% in 2003 and 61.7% in 1995. Compare this with the estimate based on $1.25 a day (2005 PPP): in 2010 absolute poverty stood at 23.7%, also sharply down from 53.1% in 2003 and 68.0% in 1995. The new poverty benchmark shows a marginal acceleration in absolute poverty reduction, but overall not much difference in rate of decrease over the last two decades.


The estimates based on national poverty line, which is fixed at NRs 19,261 (NRs 11,929 for food items and NRs 7,332 for non-food items in 2011 prices) are the same. The estimates based on NLSS III data show that about 25.2% of the people lived below the national poverty line in 2010/11. Consumption basket was changed in this round of estimate, so it cannot be strictly compared to the previous estimates. See this for more and this for poverty by district. The major contributing factors for poverty reduction are remittance income (see here and here), higher agricultural wages, urbanization (mostly propelled by rural-urban migration) and investment in public services (education and healthcare, financed mostly by donors) (see here). It has hardly anything to do with economic growth.

Poverty in South Asia

Now, lets look at how the other South Asian economies fare with the re-estimated global poverty estimate. India has the highest poverty rate (21.3%) in South Asia, followed by Nepal and Pakistan. Overall, all countries have managed to lower poverty save the Maldives.


Inequality in South Asia

Nepal lowered inequality (as measured by Gini index based on consumption) from 43.3 in 2003 to 32.8 in 2010. Similarly, Bangladesh, the Maldives and Pakistan have marginally also lowered inequality. The most progress is achieved by Nepal. Inequality seems to have increased in Bhutan, India and Sri Lanka.


Consumption share

The share in consumption of the lowest 40% of the population stood at 20.5% and the highest 40%’s share was 63.3% in Nepal in 2010. The share of consumption attributed to the lowest 40% has increased and the share of the highest 40% decreased during the last two living standard survey periods. India and Sri Lanka saw a marginal decline in the consumption share of the lowest 40% population.


Briefly about the re-estimated international poverty line

While the new poverty line is based on 2011 purchasing-power-parity (PPP), the earlier poverty line was based on 2005 PPP prices. The other methods of computing the poverty line remains the same (basically, the earlier global extreme poverty line was expressed in 2011 PPP values computed under the International Comparison Program in 2014).

The new global poverty line is computed by taking the average of national poverty lines of the 15 poorest countries (Chad, Ethiopia, The Gambia, Ghana, Guinea-Bissau, Malawi, Mali, Mozambique, Nepal, Niger, Rwanda, Sierra Leone, Tajikistan, Tanzania and Uganda) in 2011 and then converted into US dollars using 2011 PPP. So, starting October 2015 the new global extreme poverty line is $1.90 a day. About 987 million people globally (14.2% of global population) lived under this line in 2012 and it is projected to drop to around 700 million in 2015. More here and here.

A bit of timeline of the global poverty estimates:
  • $1 a day created in 1991 used 1985 PPP
  • Re-estimated to $1.08 a day using 1993 PPP
  • Re-estimated to $1.25 a day using 2005 PPP
  • Re-estimated to $1.90 a day (precisely $1.88 a day) using 2011 PPP

Saturday, October 17, 2015

Deaton vs Friedman: Is income more volatile than consumption?

Angus Deaton was awarded the 2015 Nobel Prize in economics for his "analysis of consumption, poverty and welfare."  Here you can read about his work summarized and analyzed by the Nobel committee.

One of the micro-macro issues that Deaton tackled was if income was more volatile than consumption. Milton Friedman argued that people smooth consumption over time even if they experience temporary income shock (permanent income hypothesis). In other words, consumption is not as volatile as income. However, Deaton argued that it may not be the case if people expect several bouts of income increase. In this case, consumption would not be smooth. This is the Deaton Paradox, which comes from his analysis of household's income pattern and consumption behavior. 

The Economist summarizes this:


But Mr Deaton’s work exposed this as sloppy thinking. First, he noted that the relationship between consumption and income in Friedman’s model depended on the kinds of income shocks hitting an economy. If one pay rise acts as a signal that there are more to come, then the “rational” agent in Mr Friedman’s model should anticipate future increases, and spend even more than their initial income boost. In this case, consumption should be more volatile than income, not the other way round.
So indeed it proved. Mr Deaton examined the aggregate income data more carefully, and found that it did not seem to support the idea of consumption smoothing. His microeconomic theory, allied with his empirical observations about aggregate income, together implied that income should be smoother than consumption, in contrast to what the macroeconomists had been trying to explain in the first place. This inconsistency was the Deaton paradox.


And some word of advise to economists:


As well as his specific contributions to our understanding of the world, Mr Deaton offers three lessons to aspiring economists. First, the theory should tally with the data—but if not, then do not despair. Puzzles and inconsistencies help to prompt innovation. Second, the average is rarely good enough. It is only by understanding differences between people that we can understand the whole. Finally, measurement matters. In the words of Mr Deaton, “progress cannot be coherently discussed without definitions and supporting evidence”. In the words of Mr Muellbauer, Mr Deaton’s win is “a triumph for evidence-based economics”.


Saturday, September 26, 2015

The 17 Sustainable Development Goals (SDGs)

Here is the list of the 17 SDGs agreed this week at the UN. There are many targets within each group. SDGs are the set of long term global development goals. They succeeded the MDGs.

  1. End poverty in all its forms everywhere
  2. End hunger, achieve food security and improved nutrition and promote sustainable agriculture
  3. Ensure healthy lives and promote well-being for all at all ages
  4. Ensure inclusive and equitable quality education and promote lifelong learning opportunities for all
  5. Achieve gender equality and empower all women and girls
  6. Ensure availability and sustainable management of water and sanitation for all
  7. Ensure access to affordable, reliable, sustainable and modern energy for all
  8. Promote sustained, inclusive and sustainable economic growth, full and productive employment and decent work for all
  9. Build resilient infrastructure, promote inclusive and sustainable industrialization and foster innovation
  10. Reduce inequality within and among countries
  11. Make cities and human settlements inclusive, safe, resilient and sustainable
  12. Ensure sustainable consumption and production patterns
  13. Take urgent action to combat climate change and its impacts
  14. Conserve and sustainably use the oceans, seas and marine resources for sustainable development
  15. Protect, restore and promote sustainable use of terrestrial ecosystems, sustainably manage forests, combat desertification, and halt and reverse land degradation and halt biodiversity loss
  16. Promote peaceful and inclusive societies for sustainable development, provide access to justice for all and build effective, accountable and inclusive institutions at all levels
  17. Strengthen the means of implementation and revitalize the global partnership for sustainable development


The targets within Goal #8 (Promote sustained, inclusive and sustainable economic growth, full and productive employment and decent work for all) are as follows:

8.1. Sustain per capita economic growth in accordance with national circumstances and, in particular, at least 7 per cent gross domestic product growth per annum in the least developed countries

8.2. Achieve higher levels of economic productivity through diversification, technological upgrading and innovation, including through a focus on high-value added and labour-intensive sectors

8.3. Promote development-oriented policies that support productive activities, decent job creation, entrepreneurship, creativity and innovation, and encourage the formalization and growth of micro-, small- and medium-sized enterprises, including through access to financial services

8.4. Improve progressively, through 2030, global resource efficiency in consumption and production and endeavour to decouple economic growth from environmental degradation, in accordance with the 10-year framework of programmes on sustainable consumption and production, with developed countries taking the lead

8.5. By 2030, achieve full and productive employment and decent work for all women and men, including for young people and persons with disabilities, and equal pay for work of equal value

8.6. By 2020, substantially reduce the proportion of youth not in employment, education or training

8.7. Take immediate and effective measures to eradicate forced labour, end modern slavery and human trafficking and secure the prohibition and elimination of the worst forms of child labour, including recruitment and use of child soldiers, and by 2025 end child labour in all its forms

8.8. Protect labour rights and promote safe and secure working environments for all workers, including migrant workers, in particular women migrants, and those in precarious employment

8.9. By 2030, devise and implement policies to promote sustainable tourism that creates jobs and promotes local culture and products

8.10. Strengthen the capacity of domestic financial institutions to encourage and expand access to banking, insurance and financial services for all

8.a. Increase Aid for Trade support for developing countries, in particular least developed countries, including through the Enhanced Integrated Framework for Trade-Related Technical Assistance to Least Developed Countries

8.b. By 2020, develop and operationalize a global strategy for youth employment and implement the Global Jobs Pact of the International Labour Organization

Migration, remittances and balance of payments post April 25 earthquake in Nepal

This is adapted from Macroeconomic Update, August 2015, Vol.3, No.2 (executive summary here, and FY2016 growth and inflation outlook here). It presents is the composition of Nepal’s outstanding internal and external debt. The Macroeconomic Update includes FY2015 update on real, fiscal, monetary and external sector, and growth and inflation outlook for FY2016. It provides a comprehensive macroeconomic assessment, including fiscal sustainability, after the April 25 earthquake.


I. Remittances

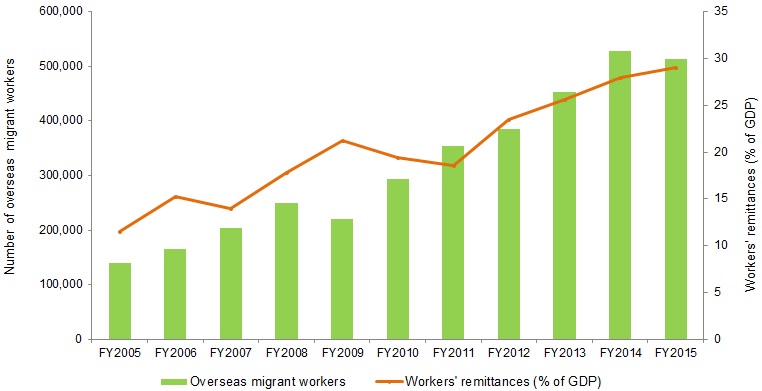
Despite the deceleration of remittance inflows till the third quarter of FY2015, the earthquake in the last quarter prompted migrant workers to drastically increase the amount of income remitted to Nepal. Consequently, workers’ remittance inflows reached a record 29.1% of GDP in FY2015, equivalent to $6.2 billion (Figure 1). In US$ terms, remittance inflows grew by 12.2%, marginally up from 11.9% growth in FY2014.[1] This follows a 16.4% growth of migrant workers (those who obtained permits form the Department of Foreign Employment).

Figure 1: Number of migrants and remittance inflows

II. Migration

According to the Department of Foreign Employment, growth of migrant workers decreased by 2.8% (Table 1) against a growth of 16.4% in FY2014 as recruitment process got derailed for over a month and potential migrant workers deferred travel plans in view of the immediate relief and temporary reconstruction works needed in the earthquake affected areas. A total of 512, 887 migrants legally left to work overseas in FY2015 (daily average of 1,405), down from 527,814 in FY2014 (daily average of 1,466). Malaysia, Qatar, Saudi Arabia, and UAE have remained the top employment destinations for low and semi-skilled Nepalese migrant workers (Figure 2). They together accounted for 92% of total migrant workers in FY2015. As a share of total migrants, Malaysia’s share increased from 34.6% in FY2013 to 40.6% in FY2014, but declined to 39.5% in FY2015. Meanwhile, Qatar’s share also decreased from 24.4% in FY2014 to 24.2% in FY2015. Saudi Arabia, Japan and South Korea absorbed higher share of migrant workers when compared to the shares in FY2014.

Figure 2: Destination-wise distribution of labor migrants

Table 1: Monthly out-migration

Number of migrants Y-o-Y growth
mid-month FY2014 FY2015 FY2014 FY2015
August     45,519     42,309 39.3 -7.1
September     24,214     51,551 -13.8 112.9
October     31,959     35,550 -15.9 11.2
November     31,949     43,213 24.7 35.3
December     41,634     53,354 19.1 28.2
January     50,032     45,362 22.4 -9.3
February     37,285     48,941 -0.5 31.3
March     48,552     44,460 24.2 -8.4
April     45,854     52,210 10.1 13.9
May     54,173     31,375 37.9 -42.1
June     54,926     37,962 21.0 -30.9
July     61,717     26,600 22.3 -56.9
Total   527,814  512,887 16.4 -2.8

III. Balance of payments

Despite the weak currency, which improved relative price competitiveness, exports failed to pick up in the first three quarters and then plunged drastically as production got severely affected by the April earthquake and its aftershocks. Merchandise exports (free on board [fob]), in US dollar terms, decreased by 3.9%-- a sharp fall from 5.1% growth in FY2014. The country exported merchandise goods worth $990.8 million, down from $1.03 billion in FY2014. Overall, merchandise exports decreased to 4.6% of GDP in FY2015 from 5.2% of GDP in FY2014. Exports to India, the People’s Republic of China (PRC), and other countries accounted for 65.5%, 2.6% and 31.9%, respectively, of total exports in FY2015.

Merchandise imports growth (cost, insurance freight [cif]) in dollar terms slowed down to 8.0% from 13.9% growth in FY2014 as it got hit due to the severe disruption in economic activities and a slump in import demand following the earthquake. Of the total imports of $7.6 billion, 14.7% was oil imports. In US dollar terms, this is equivalent to $1.1 billion, higher than the value of the country’s total merchandise exports but lower than the oil import bill in FY2014. This is primarily due to the low international oil prices and the weakening of aggregate demand in the last quarter of FY2015. Overall, merchandise imports stayed unchanged at 35.9% of GDP in FY2015 and FY2014. Imports from India, PRC, and other countries accounted for 63.5%, 12.9% and 23.6%, respectively, of total imports in FY2015.

Figure 3: Balance of payments (% of GDP)

The country’s external situation strengthened in FY2015 with the balance of payment surplus reaching $1.5 billion (6.8% of GDP). Though this is an impressive increase from the $1.3 billion (6.5% of GDP) surplus in FY2014, it is still lower than the $1.6 billion (8.2% of GDP) surplus in FY2012 (Figure 3). The large merchandise trade deficit, which reached 31.2% of GDP, was partially[2] offset by workers’ remittances, which reached a record 29.1% of GDP, and export (4.6% of GDP), resulting in a current account surplus of $1.1 billion (5.1% of GDP), up from 4.6% of GDP in FY2014. While capital transfers decreased by 14.3%, financial transfers increased by 57.0% as a result of the 35.5% jump in foreign direct investment, amounted to $44.2 million. Gross foreign exchange reserves increased from $6.8 billion in FY2014 to $8.3 billion FY2014, sufficient to cover 11.2 months of imports of goods and non-factor services.


[1] In local currency, the growth rate was 13.6% in FY2015, down 25.0% growth in FY2014.

[1] Overall, the net goods, services and income balance was a negative 28.3% of GDP, which was offset by net transfers equivalent to 33.4% of GDP, resulting in current account surplus equivalent to 5.1% of GDP.