Wednesday, April 24, 2013

Capital spending and economic growth in Nepal

This blog post is adapted from the issue focus of the ADB’s latest Macroeconomic Update (April 2013).


Need to accelerate capital spending

In addition to the declining capital budget allocation in recent years, the actual capital expenditure itself is consistently lower than the budgeted amount (Figure 1). The struggle and consistent inability to spend on time the allocated capital budget has put the issues surrounding the quality of spending on the backburner. For a developing country with tremendous need to scale up infrastructure investments to tackle head-on the binding constraints to accelerated economic activities, reduced as well as underspent capital budget is a cause of concern. ‘Crowding in’ of private investments has not happened due to the failure to ensure adequate physical prerequisites, including infrastructure. Consequently, it is not only having an impact on productivity, but is also suppressing economic growth and jobs creation below the potential. Scaling up both quantum and quality of capital spending is vital to creating the foundations for the lackluster growth to take off on sustainable path.

Figure 1: Receding capital expenditure

Source: ADB estimates based on data from Ministry of Finance

The budget allocation for capital expenditure was Rs 129.5 billion (38.3% of total budget) in FY2011, which dropped to Rs 92.6 billion (18.9% of total budget) in FY2012 and Rs 66.1 billion (16.3% of total budget) in FY2013.[1] While the budget utilization in the first six months of FY2012 was Rs 9.6 billion, it was Rs 7.7 billion in the corresponding period in FY2013, a decrease of 19.9%. The budget utilization in the same period in FY2011 was Rs 41.8 billion.

According to the line-wise budget headings for FY2013, capital expenditure consists of expenditure for the acquisition of fixed assets, including land acquisition, purchase and construction of building, furniture and fixtures, vehicles, machinery, public construction, capital improvement, and research and consultancy related to capital. Compared to the level of expenditure in the first six months of FY2012, expenditure in all of these headings except for capital formation, and research and consultancy declined in the corresponding period in FY2013 (Figure 3).[2] In the first six months of FY2013, capital expenditure was the highest in public construction (Rs 5.9 billion), followed by building construction, research and consultancy, capital improvements and land acquisition, among others. Capital spending usually starts to pick up beginning mid-year and then accelerates in the last trimester. Unfortunately, on top of low capital budget this fiscal year, expenditure has failed to pick up thus far. Even more worrisome is the indication that expenditure under public construction (roads, bridges, airports and other productive assets), which registered a negative growth of 16.6% in the first half of FY2013, is not going to pick up as expected.

Figure 2: Mid-year capital expenditure

Source: Mid-term FY2013 Budget Review, Ministry of Finance.

The lack of a timely full budget has been the main factor behind the low and ineffective capital expenditure. In FY2012, the delay in unveiling a full budget led to a dismal capital expenditure (about 3.3% of GDP, down from about 6.5% in FY2011). Worse, the delayed full budget for FY2013 has created shortage of funds in many development projects, including those funded by development partners. The projects supported by ADB alone are facing budget constraints of about Rs 17 billion.[3] As a result, disbursements of all donor-funded projects have been low. This will delay the completion of several development projects and programs. The procedural delays in requesting authorization for release of funds and the cumbersome procurement processes have further delayed capital spending. It is very likely that actual capital expenditure in FY2013 might be below 3.0% of GDP, which is lower than the level reached in FY2012.

The inability to ramp up capital spending is affecting the financial sector as well. On a cash basis, the government was running a surplus of about Rs 44 billion in the first six months of FY2013. The inability of the government to spend money, which usually flows via the banks and financial institutions, on time is also contributing to liquidity constraints. Consequently, the interbank lending rate is gradually increasing and reached 2.3% in the seventh month of FY2013, from 0.5% in the first month (Figure 17). Additionally, public capital expenditure dependent sectors (Figure 24) such as construction are not expected to pick up this year as well from a negative growth last year.[4] It not only affects employment creation, but also revenue mobilization, overall economic growth rate, and poverty reduction.

Figure 3: Construction sector and construction related capital spending, FY1975-FY2011

Source: ADB estimates based on data from MoF and CBS.

During the rest of FY2013, the government needs to accelerate capital spending through expedited approval of funding requests for projects, and allocating and releasing adequate funds for projects facing funding constraints, while cutting down delays in procurement process. However, it is also critical that the government is mindful of the quality of capital spending by ensuring sound allocation and quality utilization of the funds through sufficient internal and external control. Towards accelerating capital spending and augment its impact on economic growth, revenue mobilization, and job creation, the government should prepare and unveil a timely and full budget in FY2014 with sufficient capital budget allocation. At the same time, actions to enhance accountability and transparency of public management need to be accelerated, including the reforms for public financial management, public procurement, and other public governance functions.


[1] The partial budget initially allocated Rs 51.3 billion (14.6% of partial budget) for FY2013.

[2] Further disaggregated data is not available yet.

[3] Based on ADB’s Second Quarterly Country Portfolio Review (QCPR) assessment.

[4] Figure 3 depicts the close relationship between construction sector (which is one of the components of GDP) and construction related capital spending by the government. It also shows the contribution of construction sector to GDP growth (computed as the share of construction in GDP multiplied by construction sector’s growth rate). Construction related capital spending consists of actual government expending in land development; industry & mining; transportation (roads, bridges, aviation & others); and electricity. On an average, these spending cumulatively account for over 50% of total capital spending.

Tuesday, April 23, 2013

Renewable energy diffusion in Asia: Can it happen without government support?

Below is an abstract of one of my research papers (co-authored) recently published in Energy Policy journal:

Renewable energy diffusion in Asia: Can it happen without government support?


The dramatically increasing population of Asia necessitates equally as dramatic increase in energy supply to meet demand. Rapidly increasing energy demand is a major concern for Asian countries because the increase in demand is being met through the increased use of fossil fuel supply, largely domestic coal and imported fuel. Renewable energy supply presents a lower emission pathway that could be a viable option for steering off the higher emissions path. However, several market, economic, institutional, technical, and socio-cultural barriers hinder countries in moving from high to low emission pathway. Following a discussion on the rising demand for energy in Asia and the prospects of partly satisfying it with renewable energy, we outline the reasons for government support to tackle the barriers for widespread diffusion of grid-based renewable energy. Additionally, we also discuss workable models for strategic government intervention to support diffusion of grid-based renewable energy in Asia.


Friday, April 19, 2013

Can revenue catch up with rising recurrent expenditure?

Expenditures are already high and rising fast in Nepal. For FY2013, recurrent expenditure allocation is 68.9% of total budget of Rs 404.8 billion. While capital expenditure allocation as well as actual expenditure is declining, recurrent expenditures are rising (thanks to sharp upward revision of public sector wages, cost escalation due to high inflation among others, ad hoc spending programs in the post-conflict situation, increasing subsidies that are not well targeted to reach the real beneficiaries, etc) very fast. It could very well be unsustainable, leading to widening of budget deficit and destabilizing the macroeconomic balance maintained thus far.

At the core of it, the tax revenue (Rs 212.2 billion in FY2012) Nepal is generating might not be even sufficient to cover recurrent expenditures (Rs 243.5 billion in FY2012). The financing of capital expenditure (Rs 51.4 billion)— which is the one that contributes to building productive capacities to stimulate economic activities and generate more job opportunities— is declining, and largely financed by donors. Growth is mostly driven by agriculture (dependent largely on monsoon) and services (driven largely by remittances-backed consumption) sectors. The rising recurrent expenditure has little impact on growth. The one that could is capital expenditure (think of construction sector, financial intermediation, etc.), which, unfortunately, is declining. Below, I present some interesting charts. Readers make their own judgment.

Recurrent expenditure as a share of total actual expenditure was 76.3% in FY2012, up from 61% in FY2002. However, capital expenditure as a share of total actual expenditure declined to 16.1% in FY2012 from 30.9% in FY2002. Similarly, as a share of total budget allocation, recurrent expenditure allocation jumped from 49.4% in FY2002 to 69.3% in FY2012 and capital expenditure allocation dropped from 50.6% in FY2002 to 24.1% in FY2012 (its 16.3% in FY2013).


Looking at the growth rates, recurrent expenditure grew on an average between FY2008-FY2012) by 26.3% and capital expenditure by 14.6%. Over the same period, revenue (tax and non-tax) grew by 23.4% (overall revenue including grants grew by 22.9%). It would be hard to manage finances if expenditure growth continues to outpace revenue growth, which is largely backed by increase in tax revenue mobilization on consumption of imported goods (VAT, customs, excise, etc).


As a share of GDP, total expenditure was 20.8% of GDP (recurrent and capital expenditures were 15.9% and 3.3%, respectively) and revenue was also around 15.9% of GDP. Total trade deficit (including grants) in FY2012 was about 2.2% of GDP.

Tuesday, April 16, 2013

Nepal-India Trade: State of para-tariff barriers

[This blog post is sourced from one of the studies (workshop presentation slides here) yours truly was involved in about a year ago while working at SAWTEE. I think sharing analytical excerpts from the comprehensive report will be helpful to interested readers and researchers. This blog post focuses on para-tariff barriers on Nepali exports to the Indian market. Here are earlier blog posts on the state of tariff barriers; the issues surrounding pegged exchange rate between Nepal and India; the confidence on the Indian rupee in Nepal; and the size of Indian market for Nepal.]

State of para-tariff barriers


Besides the tariffs, India imposes other duties and charges as well on imports. These are
  • Additional duty of customs (ADC)
  • Special additional duty (SAD)
  • Education cess and the secondary and higher education cess
  • Some product-specific charges and cesses

The additional duty of custom (ADC) is aimed at removing or reducing a pro-import bias as a result of the application of central excise duties to domestically manufactured goods, in accordance with India's trade legislation. The ADC rate is equivalent to the central excise duty, which is also referred to as Central Value Added Tax (CENVAT), on domestically produced goods of the same tariff classification.[1] The general ADC rate was 10% in 2010.

The 4 percent special additional customs duty (SAD) continues to be imposed on imports, with few exceptions (14.8 percent of all tariff lines),[2] to partially compensate for sales tax, state value-added tax, local tax or other charges leviable on similar article on its sale, purchase or transportation in India. However, since the SAD is an across-the-board tax applied at a flat rate on most goods, it may not always be equivalent to local sales taxes on similar domestically produced goods, which may be higher or lower. The SAD paid on imports subsequently sold within India and for which the importer has paid state-level value-added taxes, may be refunded. In 2007, India was dragged to the WTO dispute settlement body for the application of ADC and SAD.

Since 2004, an education cess of about 2 percent of all aggregate customs duties (excluding safeguard, countervailing or anti-dumping duties if applicable) has been charged on imports. For instance, if the import duty for a certain product is 10 percent, the education cess on that product would be 2 percent of 10 percent, i.e. 0.02 percent.The secondary and higher education cess of 1 percent is also levied on all imports since 2007. This cess is calculated on the aggregate value of all excise duties (including the additional and the special duties or any other duty or excise), but excluding the education cess and safeguard, countervailing or an anti-dumping duty if applicable.

The calculation of all charges applied on imports including landing charges, the effective customs duty, the additional customs duty, the special additional customs duty, and the education cess shows an average protection of 25.6 percent compared to just 12 percent on what is said as an effective applied MFN rates (see Table 1).

Besides these duties and charges levied by the central government, additional taxes/charges are imposed by the state governments. For example, the State of Maharashtra levies an entry tax (octroi) on entry of domestic and imported goods (particularly petroleum products, tiles, and air conditioners) with rates ranging from 10 percent to 34 percent based on the product. Additionally, entry taxes are applied in several states, including Jammu and Kashmir, Himachal Pradesh, Rajasthan, Uttar Pradesh, Uttaranchal, Haryana, Punjab, Andhra Pradesh, Karnataka, Tamil Nadu, Kerala, Bihar, Assam, Orissa, Arunachal Pradesh, Chhattisgarh, West Bengal, Maharashtra, Goa, Madhya Pradesh, and Gujarat.

Table 1: Summary of India’s import charges, 2010/11 


a    Calculation for averages with extra charges include landing charges, effective custom duty, additional duty, special additional duty, and education cess.
b    ISIC Rev.2 classification.  Electricity, gas, and water is excluded (1 tariff line).
Note:      Calculations exclude specific rates and include the ad valorem part of alternate rates.

Source: WTO. 2011. Trade Policy Review India: Report by the Secretariat. Trade Policy Review, Geneva: World Trade Organization (WTO).


[1] The excise and tariff nomenclatures are harmonized at HS 8-digit level.
[2] Some 12 lines in HS71 (articles of jewellery) have SAD duty of 1%.

Friday, April 12, 2013

Nepal’s FY2013 budget brief

The government finally released a full budget (in 9th month!) for FY2013. On 9 April 2013, the President endorsed Appropriation Ordinance 2013, Financial Ordinance 2013 and Ordinance to Mobilize Internal Debt 2013. Earlier, the government released one-third budget on 15 July 2012 and two-third budget on 20 November 2012, keeping the expenditure limit at Rs 351 billion. Below is a breakdown of expenditure allocation and projected revenue for FY2013.

FY 2013
GDP growth rate (%)- revised 3.6
FULL budget allocation for FY 2013 
Rs billion %
Projected total expenditure 404.8
    Recurrent  279.1 68.9
    Capital 66.1 16.3
    Financial provision 59.7 14.7
Projected total revenue 341.0
    Revenue 289.6
    Foreign grants 47.0
    Principal repayment 4.4
Deficit financing 63.8
   Foreign loans 25.8
   Domestic borrowing 38.0

Wednesday, April 10, 2013

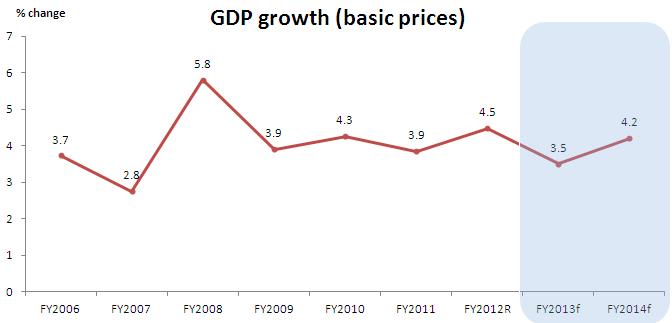
ADB forecasts Nepal’s GDP to grow by 3.5% in FY2013

The Asian Development Bank (ADB), in its flagship publication Asian Development Outlook (ADO) 2013 released today, forecasted Nepal’s GDP growth at 3.5% for FY2013 (2012/13) and 4.2% in FY2014. Furthermore, the ADO 2013 estimated regional economic growth in the Asia Pacific region to pick up to 6.6% in 2013 and reach 6.7% in 2014.

This year’s ADO focuses on Asia’s energy challenge. It notes that:

  • Developing Asia's energy needs will expand in tandem with its growing economic influence, but its own endowment is insufficient;
  • Expanding renewable energy sources will not be enough to meet future demand. Consequently, Asia needs to invest in making conventional power cleaner and more efficient; and
  • Asia must aspire to the degree of regional cooperation and integration in energy by 2030 that currently prevails in Europe.

Below are highlights from the Nepal chapter of the ADO 2013:

Economic performance in FY2013

GDP growth


  • Growth to rebound to 4.5% in FY2012
    • Agriculture sector grew by 5.0%, the highest in 4 years
    • Services sector grew by 4.5%
    • Industry sector continued to perform poorly (growth dropped to 3.0% in FY2012 from 4.4% in FY2011) -- Unfavorable business and investment climate (labor disputes, persistent electricity shortages, political uncertainties)
Inflation

  • Inflation eased to 8.3% in FY2012 (food prices declined during most of the year)
  • Stubbornly high inflation caused by:
    • Rising prices of non-food items (reflected by inflation in India)
    • Upward adjustment of administered fuel prices
    • Depreciation of Nepali rupee against third world currencies
    • Rising wages
    • Persistent supply-side constraints (power outages; market distortions by monopolists and monopsonists; infrastructure hiccups; strikes)
Fiscal sector

  • Budget deficit narrowed narrowly to 2.2% of GDP in FY2012
    • Lower capital expenditure
    • Greater revenue mobilization
      • Increase by 22.5%, reaching 13% of GDP
      • Improved efficiency in tax administration and widening of tax base
  • Not a desirable outcome for a country with large development needs and significant absorption capacity as well as multiplier effect from investment in infrastructure
  • Total expenditure was 20.4% of GDP, slightly higher than in FY2011
    • High recurrent expenditure, reaching 15.6% of GDP in FY2012 from 12.4% of GDP in FY2011
      • To cover large subsidies on fuel and ad hoc expenditure programs
  • Capital expenditure low, dropped to 3.3% of GDP in FY2012 from 6.5% of GDP in FY2011
    • Lower project disbursements due to lack of timely budget
    • Sharp drop in capital spending allocation itself
Monetary sector


  • Central bank’s proactive role and corrective policies led to containment of the fallout of real estate and housing prices
  • Robust remittance inflows boosted deposits and increased liquidity
  • Interbank rates dropped to 1.1% in FY2012 from 8.1% in FY2011
External sector

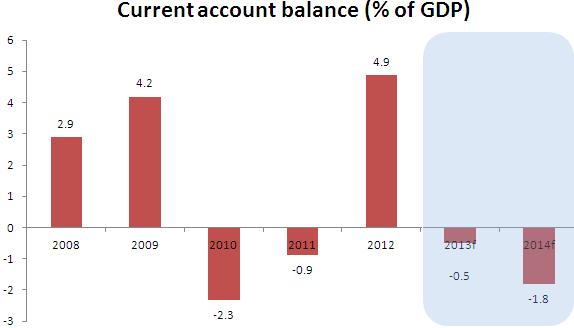
  • Current account recorded a large surplus of 4.9% of GDP in FY2012 from negative 0.9% in FY2011
    • Massive rise in remittance inflows
    • Modest import growth of 4.5% relative to export growth of 5.4%
  • Overall balance of payments surplus reached $1.6 billion
  • Foreign exchange reserves reached $4.2 billion, enough for 7.9 months of import of goods and services.


Prospects for FY2013 and FY2014


GDP growth


GDP growth in FY2013 expected to decline
  • Unfavorable monsoon
  • Shortage of fertilizers
  • Low business confidence
  • Lack of full budget
  • Subdued growth in India
GDP growth in FY2014 expected to rebound
  • Favorable monsoon
  • Adequate fertilizer supply
  • Timely and full budget
  • Moderate expansion of remittances

Inflation


Inflation in FY2013 expected to increase
  • Lower agriculture harvest
  • Wage pressures
  • Upward adjustment of administered fuel prices
  • Power shortages
  • Supply-side constraints
Inflation in FY2014 expected to moderate
  • Good harvest
  • Underlying pressures of FY2013 to persist
  • Cautious policies

External sector


Trade deficit to markedly widen in FY2013
  • Exports growth to decline
  • Subdued growth in India
  • Sluggish activity in Euro area and the US
  • Rising cost of production
  • Imports growth to sharply increase
  • Driven by remittances (lag effect as well)
Current account balance to be negative
  • Wide trade deficit
  • More moderate remittance growth

Fiscal sector

Lack of a full-fledged budget for FY2013
  • Revenue policy guided by Finance Act 2012
  • Capital budget allocation and actual expenditure low
  • Impressive revenue mobilization
  • Domestic borrowing not allowed
  • Fiscal deficit may marginally widen
Moving forward, a full and timely budget for FY 2014 is essential
  • Timely passage to allow for change in revenue policy, allow for domestic borrowing , and accelerate development activities
  • Quality of public spending, aid effectiveness and governance issues need to be addressed

Sunday, April 7, 2013

CBS projects GDP growth at 3.6% in FY2013 in Nepal

The Central Bureau of Statistics (CBS) released its annual national account estimate on 5 April 2013, projecting GDP at basic prices to grow at 3.56%, down from 4.48% revised estimate for FY2012 (fiscal year ends on 15 July). In FY2012, agriculture growth of around 5% and services growth of 4.5% propelled overall GDP growth (revised estimate) to 4.5%, up from 3.9% in FY2011. Industry sector growth dropped to 2.96% in FY2012 from 4.4% in FY2011. In 2012, the CBS’s GDP growth projection for FY2012 was 4.6%.

GDP_NEPAL FY2011 FY2012R FY2013P
GDP growth rate (basic prices) 3.85 4.48 3.56
Primary Sector 4.48 4.98 1.31
Secondary Sector 4.4 2.96 1.49
Tertiary Sector 3.42 4.51 6.03
Composition of GDP (%)  
Primary Sector 37.37 36.31 35.32
Secondary Sector 14.94 14.30 14.35
Tertiary Sector 47.69 49.39 50.33

In FY2013, the CBS projects services sector to grow by 6.03%, industry sector growth to further drop to 1.49%, and agriculture sector to grow by a mere 1.31%. The sharp drop in agriculture growth is attributed to the unfavorable monsoon and shortage of chemical fertilizers during peak paddy planting season. The industry sector continues to be beset by persistent supply-side as well as structural constraints, including power outages, labor disputes, low productivity, high cost of raw materials and production, inadequate investment climate reforms, lack of innovation and research and development, corruption, and political instability. Given the slowdown in growth of remittances, it appears services sector might grow lower than what CBS’s is projecting. Hence, 3.56% GDP growth projection is very optimistic. Taking into account the latest developments and updates, GDP will likely grow between 3.2% (the IMF says it might be even below 3%) and 3.5%. Anyway, as in previous years, services sector will contribute the largest push to GDP growth rate in FY2013.

At the sub-sectoral level (GDP consists of 15 sub-sectors broadly categorized under three sectors, namely agriculture, industry and services), the highest growing (revised estimate) sub-sectors in FY2012 were health and social work (9.95%); electricity, gas and water (8.41%); fishing (7.55%); community and social activities (6.65%); hotels and restaurants (5.96%); mining and quarrying (5.03%) and education (5.02%). Construction registered the least growth(0.22%).

In terms of contribution to GDP growth rate (sub-sectoral growth rate times its share of GDP at factor cost), agriculture and forestry had the major role, followed by transport, storage and communication; wholesale and retail trade; education; community and social activities; and real estate, renting and business activities.

In FY2013, the CBS projects wholesale and retail trade to register highest growth (9.54%), followed by health and social work (6.95%); hotels and restaurants (6.84%); transport, storage and communication (6.73%); and mining and quarrying (5.45%). The three lowest growing sub-sectors are construction (1.57%); agriculture and forestry (1.21%); and electricity, gas and water (0.2%).

In terms of contribution to GDP growth in FY2013, the largest contributor is projected to be wholesale and retail trade, followed by transport, storage and communication; agriculture and forestry; financial intermediation; and education. The least contribution would come from mining and quarrying; fishing; and electricity, gas and water. Again, the real story here is that the optimistic CBS projections for services sector might not be realistic and hence the related sub-sectoral growth, contribution to GDP growth rate, and overall GDP growth rate.

In terms of productivity and a meaningful structural transformation with higher value added jobs, the most important sector is industry (specifically, manufacturing sub-sector within it). Unfortunately, manufacturing’s share of GDP is continuously shrinking (revised estimate of 6.28% in FY2012 and projected 6.17% in FY2013). Its growth is projected to drop to 1.85% in FY2013 from 3.63% in FY2012. As mentioned earlier, it points to the persistent supply-side as well as structural constraints.

Interestingly, in US dollar terms, projected per capita GDP for FY2013 ($717) is lower than the actual per capita GDP in FY2011 ($718). Nepalese people are getting poorer! Real per capita GDP growth is projected to slowdown to 2.27% in FY2013 from 3.46% in FY2012.

Looking at the GDP figures from expenditure category, it is evident that the economy is overwhelmingly consumption based and imports are rising fast (net exports is expanding on the negative side). No surprise where the remittances are going.

Meantime, while gross domestic savings are declining (down from 14.47% of GDP in FY2011 to projected 9.34% of GDP in FY2013), gross national savings are increasing rapidly (up from 28.56% of GDP in FY2006 to projected 38.41% of GDP in FY2013). Imports of goods and services are projected to reach a record 38.79% of GDP. Exports of goods and services are projected to be just 10.34% of GDP.