Below is a presentation I made during South Asian consultation on ‘Food Justice in a Resource Constrained South Asia’, 26-27 September. The event was organized by Oxfam and SAWTEE in Kathmandu.
High Food Prices in South Asia_presentation_2011-09-27Wednesday, September 28, 2011
Latest population estimate of Nepal (26.6 million)
The Central Bureau of Statistics (CBS) has published preliminary findings of Census 2011. Surprisingly, total population in Nepal is found to be at 26.6 million, against previous estimation of around 30 million. Also, population growth rate has come down to 1.4 percent.
- Nepal’s population is 26,620,809 (male 12,927,431 and female 13,693,378).
- The annual growth of population in Nepal is 1.4 per cent which is a little less than what was found 10 years ago. In 2001, the population growth was 2.25 per cent.
- Total new addition in the population in the past decade was 3.45 million.
- The size of the household in Nepal has decreased from 5.44 in 2001 to 4.7 in 2011.The household size is recorded to be highest in Rautahat (6.33) and lowest (3.7 1) in Kathmandu.
- Absentee population increased to 1,917,903, more than double than in 2001.
- More than half of the total population of the country (50.2 per cent) lives in Terai followed by Hill and Mountain belt that constitutes about 43 percent and 7 percent of the total population respectively.
- The urban population constitutes about 17 percent of the total population.
- Kathmandu district has the largest population followed by Morang. Manang constitutes the lowest population.
- Population density of Nepal is estimated 181 per sq.kms. Kathmandu district has the highest density (4408) and Manang (3) has the least.
- Kathmandu has recorded the highest decadal population growth (60.93 %) compared to all Nepal (14.99 %) and lowest in Manang (-31.92 %).
- Sex ratio is estimated to be 94.41 (male per hundred female) in the current census as compared to 99.80 in the previous census 2001.
Reason for decrease in population growth rate:
- Migration (led to decline in fertility rate)
- 1.92 million people living abroad
- Impact of insurgency: 23 districts in hilly region saw negative population growth rate while Kathmandu saw 60 percent growth in population.
Saturday, September 24, 2011
Distorted economic advise and selfish politician
This paper investigates, in a simplified macro context, the joint determination of the (incorrect) perceived model and the equilibrium. I assume that the model is designed by a self-interested economist who knows the true structural model, but reports a distorted one so as to influence outcomes. This model influences both the people and the government; the latter tries to stabilize an unobserved demand shock and will make different inferences about that shock depending on the model it uses. The model's choice is constrained by a set of autocoherence conditions that state that, in equilibrium, if everybody uses the model then it must correctly predict the moments of the observables. I then study, in particular, how the models devised by the economists vary depending on whether they are "progressive" vs. "conservative".
The predictions depend greatly on the specifics of the economy being considered. But in many cases, they are plausible. For example, conservative economists will tend to report a lower keynesian multiplier, and a greater long-term inflationary impact of output expansions. On the other hand, the economists' margin of manoeuver is constrained by the autocoherence conditions. Here, a "progressive" economist who promotes a Keynesian multiplier larger than it really is, must, to remain consistent, also claim that demand shocks are more volatile than they really are. Otherwise, people will be disappointed by the stabilization performance of fiscal policy and reject the hypothesized value of the multiplier. In some cases, autocoherence induces the experts to make, loosely speaking, ideological concessions on some parameter values. The analysis is illustrated by empirical evidence from the Survey of Professional Forecasters.
Here is the full paper by Gilles Paul.
Friday, September 23, 2011
Unusually high wage overheads & low labor productivity in Nepal
The chart says it all.

Nepal has the highest labor cost in South Asia and probably the lowest labor productivity. Where is our labor cost competitiveness going? Hello, labor unions?? Hello, FNCCI?? Hello, government??
Wednesday, September 21, 2011
Four million missing women each year in developing countries
The latest World Development Report 2012 (Gender Equality and Development) argues that “countries that create better opportunities for women and girls can raise productivity, improve outcomes for children and make institutions more representative, and advance development prospects for all.”
- Excess female mortality after birth and “missing” girls at birth account for an estimated 3.9 million women each year in low- and middle-income countries.
- About two-fifths are never born due to preference for sons, a sixth die in early childhood, and over a third die in their reproductive years.
- Ensuring equal access and treatment for women farmers would increase maize yields by 11 to 16 percent in Malawi and by 17 percent in Ghana.
- Improving women’s property rights in Burkina Faso would increase total household agricultural production by about 6 percent, with no additional resources—simply by reallocating resources such as fertilizer and labor from
men to women. - The Food and Agriculture Organization estimates that equal access to resources for female farmers could increase agricultural output in developing countries by as much as 2.5 to 4 percent.
- Eliminating barriers that prevent women from working in certain occupations or sectors would have similar positive effects, reducing the productivity gap between male and female workers by one-third to one-half and increasing output per worker by 3 to 25 percent across a range of countries.
- Among developing countries, girls now outnumber boys in secondary schools in 45 countries, and there are more young women than men in universities in 60
countries. - Women in low-income countries not only outlive (life expectancy) men but live 20 years longer than they did in 1960.
- Gaps in labor force participation have narrowed with over half a billion women having joined the workforce in the last 30 years.
The report calls for action in four areas:
- Addressing human capital issues, such as excess deaths of girls and women and gender gaps in education where these persist
- Closing earning and productivity gaps between women and men
- Giving women greater voice within households and societies
- Limiting the perpetuation of gender inequality across generation
In South Asia:
- Missing girls at birth in South Asia —excluding India— was 1,000 in 2008.
- But, missing girls at birth increased in 2008 in India to 257,000.
- The abuse of new technologies for sex-selective abortions, such as cheap mobile ultrasound clinics, accounted for much this shortfall, despite laws against such practices in many nations.
- In countries like Afghanistan and Pakistan, discrimination by parents toward girls is still a serious problem.
- Bangladesh and India have maternal mortality ratios comparable to Sweden’s around 1990, and Afghanistan’s similar to Sweden’s in the 17th century.
- Maternal mortality ration was 280 maternal deaths per 100,000 live births in 2008.
- In 2008, there were about 95 girls for every 100 boys in primary school in the region.
Monday, September 19, 2011
Over five decades of experience with SEZs
A nice review (by Thomas Farole) of what we have learned from special economics zones (SEZs) in the past 50 years. SEZs are primarily aimed at attracting FDI, to increase employment, to support wider economic reform strategy, and to test application of new policies and approaches to industrial growth. SEZs have been increasingly becoming popular in developing countries after its success in East Asia, which enjoyed a favorable export-led growth. Its number has grown rapidly: from 176 zones in 47 countries in 1986 to 3500 zones in 130 countries in 2006.
Traditionally, EPZs were designed to attract FDI by allowing companies to exploit low-cost labor and other relaxed barriers to investment (regulatory, infrastructure, tax, exchange controls, licensing). Mauritius, Malaysia, South Korea, China, Taiwan, Honduras, El Salvador, Madagascar, Bangladesh, Vietnam and Dominican Republic successfully operated SEZs and created thousands of jobs in manufacturing sector and bring about structural transformation. Typically most of the industries in SEZs are labor intensive and assembly-oriented activities, including light manufacture goods such as textiles, apparel, leather, and light electrical and electronic goods.
However, this model is reaching its limit due to changed macroeconomic and regulatory environment in the global economy. Now, the relevance of SEZs will depend on “the effectiveness with which they are designed, implemented, and managed on an ongoing basis that will determine success or failure.” Just attracting investment, creating jobs, and generating spillovers to local economy, and adopting a compelling master plan will not suffice. Since Nepal is ready to enact a SEZ bill and is preparing to build SEZs, it will have to learn from SEZs experience in the past and how effective it will be in the rapidly changing global markets and demand.
Lesson learnt as outlined by Farole:
- Some countries have been more successful in attracting FDI, encourage export-oriented production, and create jobs than others.
- SEZs should be designed to leverage country’s comparative advantage. For instance, Bangladesh used its low-wage labor factor to take off to be a successful garment exporter. It initially focused on attracting high-tech investment but was only successful when it adjusted SEZs design and incentives to suits its comparative advantage, i.e. low-wage labor. Bangladesh provided good incentives such as serviced industrial land infrastructure and relatively reliable supply of power. Infrastructure reliability is an important aspect on SEZ success.
- The incubation period is might be high. It took 5 to 10 years to build momentum in China and Malaysia.
- Private sector involvement is key. For instance, Honduras’s success is led by local entrepreneurs and private sector, who were allowed to developed zones. The government focused on providing regulatory framework, supplied critical infrastructure and services and on-site customs services.
- Failure of SEZs in Africa is primarily linked to the political interference, mainly the failure to separate political support from political objectives in zone projects. Zones are for commercial success, not a political tool. Furthermore, the success depends on how entwined SEZs are with competitiveness of national economy and national investment environment. Critical infrastructure should be adequately supplied so that zones are linked to ports and markets. There should be clear legal and regulatory frameworks.
- Small countries should look to exploit potential for using zones to link up regional suppliers and leverage economies of scale in production.
- For dynamic economic benefits, domestic firms should be encouraged to locate inside zones, strengthen forward and backward links, support business and facilitate movement of skilled labor and entrepreneurs between the zones and the domestic economy. There should be continual training of human resources. This helps in bring structural transformation.
- Sustainability should also be a top priority. It means gender balance, environment conscious activities, clear standards, and effective monitoring and evaluation. SEZs can also be seen as an opportunity to experiment with policy innovations.
Friday, September 16, 2011
Inequality: Status, Effects, Causes & Solution
This blog post is a collection of major points from the latest edition of Finance & Development magazine. It deals with inequality and its various dimension.
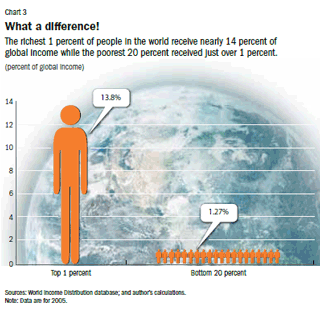
Global inequality is higher than inequality within nations, argues Branko Milanovic. The richest one percent of people in the world receive nearly 14 percent of global income while the poorest 20 percent receive just over one percent of global income. He argues that “global inequality seems to have declined from its high plateau of about 70 Gini points in 1990–2005 to about 67–68 points today.This is still much higher than inequality in any single country, and much higher than global inequality was 50 or 100 years ago.”
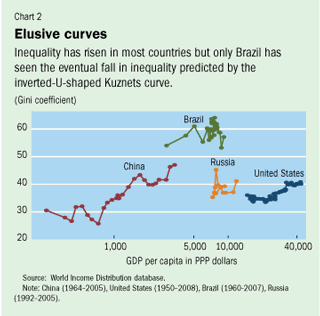
The rising inequality in both developed and developing countries is against the prediction of Kuznets upside-down “U” shaped curve and Heckscher-Ohlin-Samuelson (HOS) theorem. Kuznets argued that when everyone is poor inequality is very low. Then as people being to move form low productive agriculture to high productive non-agriculture sector, average income rises as wages also rise. This means as economy growth, inequality rises. But, economies grow richer, urban-rural gap is reduced and social security transfers (unemployment benefit, pension) lower income gap and hence inequality. The Hecksher-Ohlin-Samuelson theorem predicts that in international trade countries specialize on production of goods in which they have comparative advantage. The poor countries specialize in production of goods that requires low skill. This means demand for low skill goods rises as they cost less. Then wages of low-skilled workers increases relative to high-skilled workers. The narrowing gap between wages of different skill levels means that inequality is declining. But, are these evidence holding up now?
 Milanovic argues that Kuznets was right during the early days of the US (up until 1970s)and the UK (up until 1920s). But, inequality is rising now when average mean income is also rising. Similarly, inequality in poor countries is also rising, which is counter to HOS theorem.
[The Chinese case shows application of ‘Kuznetsian’ case, may be till the half part of the curve: Gini was 30 before 1978, i.e. when the country uniformly poor and before economic reforms. Then massive growth in coastal areas major manufacturing hubs and sectors led to increase in wages of the workers involved those sectors. Meantime, China also saw massive increase in economic growth. But, inequality is still rising and has surpassed the inequality prevalent in the US. Milanovic argues that Chinese government can help reduce inequality by extending social security to people outside the state sector or introduce unemployment benefits or, preferably, implement guaranteed rural employment scheme like NREGA in India.]
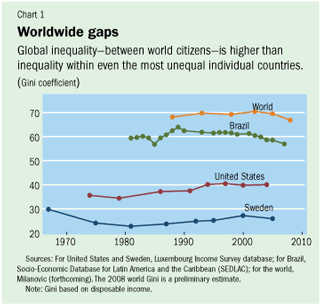
In 2010, real per capita income in the United States was 65 percent above its 1980s level and in the United Kingdom, 77 percent higher. Over the same period, inequality in the United States increased from about 35 to 40 or more Gini points (see Chart 1), and in the United Kingdom, from 30 to about 37 Gini points. These increases reflect significant adverse movements in income distributions. Overall, between the mid-1980s and the mid-2000s, inequality rose in 16 out of 20 rich OECD countries. This coincidence of rising mean income and rising inequality in mature economies would no doubt have surprised Kuznets, as it did many economists.
Inequality also rose in China, a poor country with comparative advantage in unskilled labor–intensive products, whose trade-to-GDP ratio jumped from about 20 percent to more than 60 percent in 2008. The HOS theorem of globalization predicts that inequality would have fallen as wages of low-skilled workers relative to skilled workers rose. In fact, however, China’s Gini coefficient rose from less than 30 in 1980 to about 45 today. Once again, fact confounds theory.
He identifies four potential causes of rise (stable in some countries) in inequality:
- technological progress (favored skilled workers, whose wages increased more)
- institutional change (higher taxes and social transfers—redistribution)
- changing social norms (society encourage high wages by skilled workers)
- globalization (specialization in high-skilled exports increases wages of the skill group)
He stresses that social transfers, unemployment benefits, guaranteed employment in rural areas like NREGA in India, social support programs such as Oportunidades in Mexico and Bolsa Familia in Brazil might help to reduce inequality. The decline in inequality in Brazil (from Gini of around 60 in 2000 to 57 today) can be attributed to social support programs, and broader access to education that increased the supply of skilled workers. Still, Brazil remains among the five most unequal countries in the world.
Berg and Ostry explore if there is a trade-off between equality and efficiency? They say NO, especially in the long term there is no trade-off between efficiency and equality.
In fact equality appears to be an important ingredient in promoting and sustaining growth. The difference between countries that can sustain rapid growth for many years or even decades and the many others that see growth spurts fade quickly may be the level of inequality. Countries may find that improving equality may also improve efficiency, understood as more sustainable long-run growth.
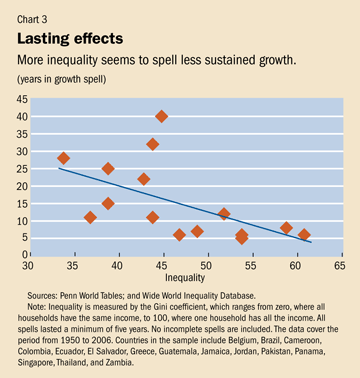
[…]inequality is strongly associated with less sustained growth. […]too much inequality might be destructive to growth. Beyond the risk that inequality may amplify the potential for financial crisis, it may also bring political instability, which can discourage investment. Inequality may make it harder for governments to make difficult but necessary choices in the face of shocks, such as raising taxes or cutting public spending to avoid a debt crisis. Or inequality may reflect poor people’s lack of access to financial services, which gives them fewer opportunities to invest in education and entrepreneurial activity.
[…]a 10 percentile decrease in inequality (represented by a change in the Gini coefficient from 40 to 37) increases the expected length of a growth spell by 50 percent. The effect is large, but is the sort of improvement that a number of countries have experienced during growth spells. We estimate that closing, say, half the inequality gap between Latin America and emerging Asia would more than double the expected duration of a growth spell in Latin America.
Kumhof and Ranciere argue that higher income inequality in development countries is associated with higher domestic and foreign indebtedness.
Subscribe to:
Posts (Atom)