Wednesday, December 26, 2012

The state of cooperatives in Nepal

The financial sector in Nepal is still adjusting to the jolt it experienced after the decline in real estate and housing prices in mid-2011, triggered by slowdown in remittances growth as a result of global economic slowdown. Several corrective measures by NRB and MoF have been fairly successful in containing the situation for now. Note that the core structural, governance and operational problems of the BFIs remain the same. Minor adjustment is not the way to sustainable financial sector in Nepal. More here.

Anyway, beyond the developments in the BFIs, the activities of cooperatives have largely been ignored. Since the NRB is not mandated to supervise and monitor cooperatives, the Department of Cooperatives— which severely lacks technical capabilities and resources—is facing a hard time managing them. Bankers and government officials are worried that the risky deposit and lending activities of cooperatives might hit the whole financial sector hard.

A lot of information is still muddy due to the lack of clear and consistent data on the activities of cooperatives. Better understanding of the nexus between BFIs and cooperatives, lending activities, risk portfolios, state of NPLs, operational efficiency, viability and sustainability is urgently needed in order to not only avoid a potential financial turbulence, but also to ensure an improved access to finance, and inclusive growth and development.

The chart and table give an initial grasp of the state of cooperatives in Nepal. Nearly half of the cooperatives are Savings and Credit co-ops (whose share of total lending and deposits is 78.78% and 70.52% respectively). And, almost 20% of co-ops are in Kathmandu Valley. Most of their lending is in real estate and housing sectors and loans are usually given without satisfying internal due diligence process.


The table shows the financial state of cooperatives vis-a-vis the BFIs. Its amazing that cooperatives have larger deposit and lending volume than development banks and finance companies.

State of cooperatives and BFIs in FY2012
Financial institution Deposit (Rs bn) Lending (Rs bn)
Number
Cooperatives (2012) 139.54 134.03 26501
    Bhaktapur 6.07 6.13 525
    Lalitpur 13.52 13.25 929
    Kathmandu 80.55 60.22 3578
BFIs (mid-July 2012) 1071.39 779.56 213
    Commercial 867.99 612.32 32
    Development 127.3 100.61 88
    Finance 76.14 66.63 70
    Microcredit 5.18 17.75 23

The proliferation of cooperatives (about one cooperative per 1000 people) and their lending concentration in sectors that might see drastic price adjustments (or is happening right now) could trigger a financial crisis within this loosely regulated semi-banking sector. Worse, the crisis might seep into the BFIs (Class A, B and C institutions) and eventually the real sector. Uncertain times ahead for the financial sector in Nepal!

Friday, December 21, 2012

Illicit financial outflows from Nepal 2001-2010

A latest report from Global Financial Integrity (GFI) has ranked Nepal 58 out of 143 countries in terms of average annual illicit financial flows— the cross-border movement of money that is illegally earned, transferred, or utilized— between 2001 and 2010. On an average, from Nepal, between 2001 and 2010 US$801 million was illegally earned, transferred, or utilized.


Furthermore, cumulative illicit outflows in hot money narrow plus and trade misinvoicing components were US$355 million and US$7.658 billion. In total, this makes US$8.013 billion total illicit outflows from Nepal. The largest illicit outlflows came from trade misinvoicing (export under-invoicing and import over-invoicing).

The figures are based on Hot Money Narrow Plus Trade Mispricing method (HMN+GER) non-normalized methodology. This methodology doesn’t include trade mispricing in services, same-invoice trade mispricing, hawala transactions, and dealings conducted in bulk cash. Last year’s report used a trade mispricing and external debt data and found that the total illicit financial outflows from Nepal over the period 2000-2009 was US$6.0 billion (cumulative outflows from 1990 to 2008 was estimated at US$9.1 billion). It uses the official balance of payments and trade data reported to the IMF by member countries and external debt data reported by those countries to the World Bank.

The GFI notes that illicit financial flows “generally involve the transfer of money earned through illegal activities such as corruption, transactions involving contraband goods, criminal activities, and efforts to shelter wealth from a country's tax authorities”.

Overall, crime, corruption, and tax evasion cost the developing world US$858.8 billion in 2010, just below the all-time high of US$871.3 billion set in 2008—the year preceding the global financial crisis. From 2001 to 2010, developing countries lost US$5.86 trillion to illicit outflows. 

In South Asia, India saw the largest illicit financial outflows, followed by Bangladesh, Nepal, Sri Lanka, Pakistan, Afghanistan, and Bhutan and Maldives. 

Total illicit financial outflows from South Asia (USD million)
HMN + GER 2007 2008 2009 2010
Afghanistan 0.00 0.00 41.24 110.19
Bangladesh 2737.35 848.42 648.94 2367.17
Bhutan 136.56 0.00 0.00 0.00
India 4922.82 26819.56 279.42 1613.34
Maldives 4.02 0.00 0.00 0.00
Nepal 584.15 883.29 1551.31 1883.95
Pakistan 505.17 727.80 298.14 729.00
Sri Lanka 165.16 0.00 0.00 880.65

The GFI has called for increasing transparency in the international financial system as a means to curtail the illicit flow of money. The ones related to Nepal include (i) reforming customs and trade protocols to detect and curtail trade mispricing, which is done to avoid duties or taxes; (ii) harmonizing predicate offenses under anti-money laundering laws across all Financial Action Task Force cooperating countries; (iii) ensuring that the anti-money laundering regulations already on the books are strongly enforced.

Monday, December 17, 2012

Nepal has the highest minimum wage in South Asia? - Part II

The blog post about changes in minimum wages in South Asia and the rapid rise in wages in Nepal, which meant that we might not have comparative advantage in labor cost, created quite an interest among readers. The wages (monthly minimum wage in US$) was for manufacturing sector only. In this blog post I am presenting further analysis, based on the latest ILO Global Wage Report 2012-13, using national level monthly minimum wage data. At the outset, note that labor productivity in Nepal appears to be decreasing (see this blog post for more).

The figure below shows that up until 2005, Nepal had the second lowest minimum wage (US$33.54 per month) in South Asia. In 2006, it increased by 35.21%, the highest increase than any other South Asian country,  to reach US$45.36 per month. As of 2011, Nepal has the highest minimum wage in South Asia (US$83.76 per month), followed by Pakistan (US$82.17 per month), India (US$ 64.07 per month), Sri Lanka (US$51.22 per month), and Bangladesh (US$40.46 per month)—and which partially explains the increasing manufacturing sector investment in Bangladesh (also dubbed as the next RMG sourcing hotspot by McKinsey).


Regarding the growth rate of minimum wages, Nepal had the largest average growth (2006-2011) both in dollar and local currency terms. Bangladesh and Sri Lanka are taken out of the picture because of lack of full data for the period mentioned above. The average monthly minimum wage (2006-2011) in Nepal increased by 17.77% in dollars and by 18.67% in local currency. For comparative purpose, I have used official exchange rate (local currency unit per US$, period average) to convert local currency wages into US$. The currency movement makes a difference in sales and profits, which will then, to some extent, influence investment or expansion decisions (depreciation along with strong domestic and overseas demand is normally good). Here the minimum wage for Bangladesh corresponds to that of garment sector; overall private sector for India, Nepal and Pakistan; and manufacturing sector for Sri Lanka. All minimum wage data refer to that of unskilled workers in non-agriculture enterprises.


With regard to real wage (in local currency), on average between 2006 and 2011, Nepal had the highest  growth rate (of 5.3%), followed by Bangladesh 3.1% and Pakistan, 2.1% (India and Sri Lanka had negative real wage growth).


Furthermore, the nominal mean daily wage has increased by 127% and 98% in agriculture and non-agriculture sectors, respectively, between 2003/04 and 2010/11 (i.e., between the two household surveys).


Well, in one of the aspects crucial for new investment or expansion of existing investment, Nepal is already at the losing end [Note that, higher wages are not bad in itself as long as they are matched by rise in productivity]. It is further amplified by long hours of power cuts, political instability, excessive labor unionism, low productivity, infrastructural bottlenecks (inadequate and uneven supply of roads, water supply, etc.) and policy unpredictability as well as paralysis.  Against this backdrop, enticing investment in manufacturing sector is a daunting challenge.

Due to high focus on energy and transport (the above listed investment hiccups are less persistent in these sectors) and attractive incentives, foreign investors have planned for sizable investments in key sectors. However, these won’t immediately boost employment and spur economic activities, except for construction sector workers and construction materials produced domestically, throughout the 15 sectors that make up the GDP. With the relaxation of the most binding constraint, i.e. energy shortage, almost all sectors are expected to experience better economic activities. Until then the challenge is to entice investments in other sectors as well. For this the resolvable constraints have to be resolved with decisive political will (like labor issues, skills upgradation, targeted application of import tariffs—eg. agriculture inputs are taxed more than final product) in order to boost efficiency and productivity. The pressing needs are to achieve higher economic growth, generate enough employment opportunities and institutionalize inclusive growth and development activities without negatively impacting efficiency, competitiveness and productivity.

Saturday, December 15, 2012

How globally connected is Nepal?

A report released last month, DHL Global Connectedness Index (GCI) 2012, ranks Nepal 133 out of 140 countries, the same as last year’s ranking, in terms of global connectedness or globalization. Nepal has the lowest ranking in South Asia region. In South Asia, India is steadily improving connectedness, ranking 62 out of 140 countries, followed by Sri Lanka (rank 75), Bangladesh (rank 91)and Pakistan (rank 102).


The report notes that Nepal has higher breadth (98th) than depth (137th). Among Nepal’s component level depth ranks, its highest is on outbound international students (41st) and its lowest is on merchandise exports (140th). Over half of Nepal’s merchandise exports goes to India and has a trade pillar ranking of 136 out of 140 countries (also read the changing narrative of the state of Nepal’s globalization).

Depth measures how much of a country’s activities or flows are international versus domestic by comparing the size  of its international flows with relevant measures of its domestic economy (usually as a share of GDP). Breadth complements depth by looking at how broadly the international component of a given type of activity is distributed across countries (usually diversification of sources for the scores in the pillars).

They are based on scores in four pillars, namely trade, capital, information and people. The depth dimension provides Nepal’s outward and inward depth scores and ranks at the component and pillar levels. Using the same pillars as in depth, the breadth dimension considers the intra-regional share of each Nepal’s flows. The components of trade are merchandise trade (% of GDP), services trade (% of GDP); capital components are FDI stock (% of GDP), FDI flows (% of GFCF), portfolio equity stock (% of GDP) and portfolio equity flows (% of GDP); information components are speed of internet bandwidth, cost of international phone calls, cost of printed publications trade; and people components are migration (% of population), tourists departure and arrival per capita, international students.

The Netherlands retained its 2010 position as the world’s most connected country. Of the top ten most connected countries in 2011, nine of them are located in Europe, which is the world’s most connected region. Meanwhile, Sub-Saharan Africa is the least connected region today, but Sub-Saharan African countries averaged the largest increases in connectedness over the past year, with their gains driven primarily by the trade pillar.

GCI measures the depth and breadth of countries’ trade, capital,  information, and people flows. Twelve distinct components  of connectedness are incorporated across those four pillars. Overall, richer countries tend to have deeper and broader global connections than poorer countries. Smaller countries tend to lead on depth while larger countries tend to lead on breadth.

In the latest Global Information Technology Report 2012 as well Nepal ranked poorly at 128 out of 142 countries in terms of network readiness. Insufficient development of ICT infrastructure has limited its ability to leverage information and communications technologies to boost country competitiveness. It has stifled entrepreneurship and innovation.

Wednesday, December 12, 2012

The state of energy security and access in Nepal

We often hear that Nepal has a huge potential (and possibly comparative advantage) in hydropower generation. So far this has been a trigger-happy statement that makes political leaders and bureaucrats smug about what Nepal has in store to usher the economy on a high growth path, and competitive production and manufacturing bases. Unfortunately, in reality, the country reels under increasing power cuts, sometimes reaching as high as 18 hours a day, during dry season. Amidst the increasing politicization of hydropower sector, weak institutions, and pockets of hostility toward investment originating from certain countries at a time when there is inadequate finance available to realize even a medium sized project, the competitiveness of economy is eroding and exports are declining, leading to a situation where high remittance inflows are providing a lifeline support to the economy.


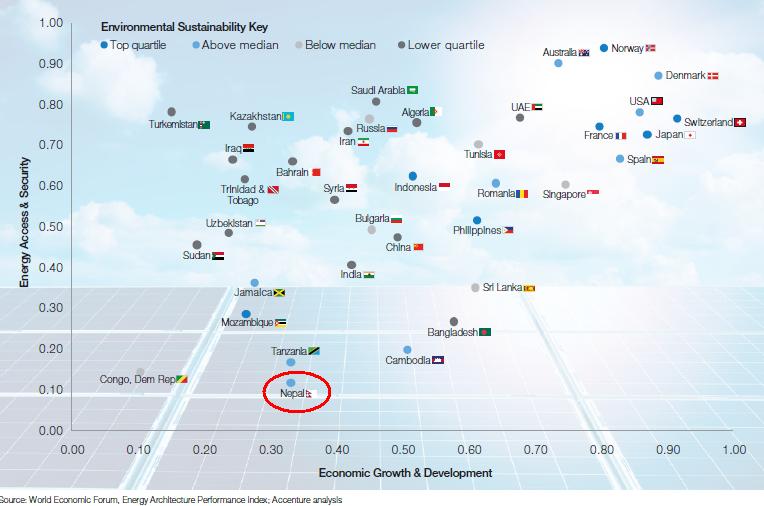
As of now, what is the state of energy security and access in Nepal, which has electrification rate of about 61.2%, the second lowest in South Asia region? It has the lowest electric power consumption in the region (91 per capita kWh).  The latest Global Energy Architecture Performance Index (EAPI) 2013 ranks Nepal 101 out of 105 countries in EAPI, which is composed of three sub-indices, namely economic growth and development (rank: 89— measured through the energy intensity, cost of energy imports, share of mineral products in export, and a combination of GDP per capita and HDI); environment sustainability (rank:13— measured through the carbon intensity of energy use, share of non-carbon energy sources in the energy mix, levels of outdoor air pollution, and water scarcity); and energy access and security (rank: 103— measured through import dependence, diversity of supply, quality of electricity supply, and access to modern forms of energy). In short, it shows that the state of energy security and access is pathetic in Nepal. It further reinforces the argument that Nepal needs to urgently ramp up investments in energy generation (largely hydropower) to achieve faster and inclusive economic growth and a competitive economic base.


The top ranked nations are Norway, Sweden, France, Switzerland and New Zealand. From South Asia, India is ranked at 62, Sri Lanka 69, Pakistan 88, and Nepal 101. The energy architecture is defined as “the integrated physical system of energy sources, carriers and demand sectors shaped by business, government and civil society”.

The four mutually supportive pillars required for greater energy security and access are:
  • Policy initiatives, especially clear rules, price signals and risk-return incentives
  • Technology and infrastructure to address specific challenges in the value chain
  • Market structures that enables producers to meet consumers’ needs efficiently
  • Human capital to constantly innovate and stay competitive
These are necessary to generate economic growth and development in an environmentally sustainable way while providing energy access and security for all.

Friday, December 7, 2012

Confidence on the Indian rupee in Nepal

There is an interesting story in yesterday's Republica (“Nepali village using Indian currency only”, p.10) about the use of Indian currency for daily transaction purpose in Sonvarsa VDC of Siraha district. Sonvarsha is located 6 km from Laukaha market in India.

Below is an excerpt from the article:

“We accent IC only from our customers. It might be surprising for people of other places but it’s a common practice here,”  Ram Datta Yadav, a vegetable vendor at a local fair, said. he further said that other traders are also using IC in local markets.
Ram Udgar Yadav, a local customer also said local people use IC to purchase goods as they trust Indian currency more than Nepali banknotes. “Even if we wish to exchange Nepali rupees, we have a compulsion to pay high exchange rate,” he said.
Nabin Yadav of Bharanwarajpur of Siraha also said that all the transactions from real estate to household goods takes place through Indian currency. “Traders also expect IC from the buyers and buyers also find it more convenient to make purchases in IC,”added he.

This short article provides a sense of the increasing confidence on the Indian currency in the border towns in Nepal. Recently, there was a shortage of Indian currency in the exchange market and the banks are pretty strict in giving Indian rupee. The central bank had imposed a cap on daily IC withdrawal from ATMs in India. Indian currency of less than or equal to IRs 100 can be freely used in Nepal for daily transaction purpose. Also, people having bank accounts in Nepal can easily withdraw Indian rupee from ATMs in India.


The increasing confidence on the Indian rupee in turn reflects the declining confidence on the Nepali rupee. Nepali rupee is pegged to Indian rupee at IRs 1= NRs 1.60 since 1993. In real terms (adjusted for inflation in both countries), the exchange rate with India is appreciating, eroding the competitiveness of Nepali goods and services (see the figure below). In its 2012 Article IV consultation, the IMF also argued that there has been an overvaluation (REER) of Nepali rupee against Indian rupee. Over 50% of exports and imports goes to and comes from India (informal trade is also pretty high). India provides the only exit point for third country trade. India is the sole supplier of petroleum fuel and LPG to Nepal. Nepal has a huge trade deficit with India. Importantly, there is free flow of goods and labor between the two countries. More on this topic here.


While the Indian economy is surging ahead, the Nepali economy is struggling to achieve even 5% growth rate. The pegged currency provides a cushion for Nepali economy in terms of its ability to combat inflation and maintain some form of macroeconomic stability. The high inflation in Nepal, lingering political uncertainty, unresolved infrastructural as well as structural constraints, receding absorption capacity along with low capital expenditure, unfavorable industrial relations and gloomy growth prospects have induced people to hold stronger currency instead of a struggling one. Hence, the tendency to hold Indian rupee and do transaction with it is not surprising. People perceive that Nepali currency might further lose value in real terms in the coming days. In fact, despite official exchange rate remaining constant since 1993, the ground reality in the border towns is that traders and retailers transact IRs 100 with NRs 163 (even NRs 165).

So far the central bank has been able to maintain supply of Indian rupee more or less to the required amount (discount the occasional spikes in demand for IRs created by currency speculators informally) by even selling over US$1 billion of reserves to purchase IRs. As long as remittances continue to increase and forex reserve keeps rising, there won’t be much issue as imports will get easily financed. If something goes wrong in this process (say decline in reserves), then the economy will be in trouble.

The solution would be to restore confidence on the Nepali rupee. For this to happen, growth prospects should be good; manufacturing output and exports have to increase; more investment has to come into sectors that have the capacity to relax critical binding constraints; interest rates have to be generally higher than in India; industrial and investment climate have to be good; and inflation has to be controlled to the extent possible by tackling the resolvable supply-side constraints

Average annual growth rate, 1992/93-2009/10
Nepal India
Real GDP 4.39 7.03
  Agriculture 3.14 3.03
  Industry 4.13 7.30
  Services 5.26 8.61
Exports 9.50 14.05
    to India 22.27
Imports 15.24 14.35
    from India 18.31
Inflation
6.90
7.10
Nepal's trade with India (Rs billion)
1992/93 2009/10
Exports 1.62 39.99
Imports 12.54 217.11
Trade deficit 10.92 177.12
Exchange rate (NRs/IRs)
Nominal
1.6 1.6
Real 1.36 1.92

Tuesday, December 4, 2012

Article IV Consultation 2012: Assessment of the Nepali economy by the IMF

In this year’s Article IV Consultation, the IMF has warned that the political uncertainty is complicating macroeconomic management in Nepal. The usual narrative about economic growth, expenditure concerns, and greater reliance on remittances for financing consumption and imports holds.

The IMF projects real GDP growth to decline to 3.8% in FY2013, thanks to unfavorable monsoon which affected agriculture production, slower services activity due to a potential decline in remittance growth, and a slowdown in growth in India (lower export demand, weaker inward investment, and possibly less remittances). The IMF’s latest growth projection exactly matches the ADB’s latest projection in ADO Update. But, while ADB projected inflation to be at 8.5%, the IMF projects it to be 8.3%.

Some notable observations and suggestions include:

  • Quasi-fiscal liabilities continued to rise through financial losses at the Nepal Electricity Authority and Nepal Oil Corporation. Build political consensus to adopt an automatic price adjustment mechanism while putting in place well-targeted subsidies to protect the vulnerable.
  • Significant restructuring of the financial system has yet to emerge, and balance sheet risks from concentrated exposure to a moribund real estate market are high.
  • Focus on sound policies and structural reforms should be maintained. In 2011, the IMF suggested to enact structural reforms to raise productivity and potential growth.
  • Enact a full budget and strengthen public management to ensure full executive of capital budget.
  • Enhance revenue mobilization efforts but saw work on further tax and customs administration reforms.
  • Targeted and well sequenced acceleration of financial sector reforms, including the amendment of NRB Act to improve the governance of the financial sector.
  • A tightening of monetary policy may be used to signal commitment to price stability and support exchange rate peg.
  • Open market operations and regular auction of T-bills good to mop up excess liquidity.
  • Enhance the business environment, remove infrastructure bottlenecks, increase transparency, and improve governance.

The projection of major macroeconomic indicators for FY2013 are shown in the table below.

Indicator 2009/10 2010/11 2011/12e 2012/13f
Real GDP growth 4.8 3.9 4.6 3.8
CPI (period average) 9.5 9.6 8.3 8.3
Total revenue and grants (% GDP) 18 17.7 18.3 18.1
Expenditure (% GDP) 18.8 18.6 18.2 18.6
Broad money (%change) 14.1 12.3 22.7 12.5
Domestic credit (%change) 16.8 14.6 8 14.4
Private sector credit (%change) 14.2 13.9 11.3 13
Gross investment (%GDP) 37.1 32.5 32.8 32.9
Private investment (%GDP) 30 25.3 25.7 26
Central government (%GDP) 7.1 7.3 7.1 6.9
Gross national saving (%GDP) 34.7 31.6 37.5 33.5
Current account (%GDP) -2.4 -1 4.7 0.6
Trade balance (%GDP) -25.6 -23.6 -23.7 -27.3
Gross official reserves (US$ million) 2,844 3,085 4,307 4,595
Public debt (%GDP) 35.4 33.3 33.3 31.3
GDP at market prices (Rs billion) 1,193 1,368 1,557 1,750
GDP at market prices (US$ billion) 16 19 19.4 20.3

Here is the IMF’s preliminary assessment released on September. The assessment in 2011 is here.