Showing posts with label Investment. Show all posts

Wednesday, March 1, 2023

Effect of countercyclical investment on employment

An interesting paper by Buchheim and Watzinger (2023) published in AEJ: Economic Policy [15(1)] shows that investments in public buildings in Germany can quickly and cost-effectively increase employment in the short run. They can be a viable tool for counteracting an economic slowdown. 

They explore if the renovation of public buildings create jobs quickly and cost-effectively? Their paper estimates the causal impact of a sizable German public investment program, which provided 0.16% of GDP for upgrading public buildings, on employment at the county level. The program focused on improving the energy efficiency of school buildings, making it possible to use the number of schools as an instrument for investments. It also enforced tight deadlines, reducing potential implementation lags. The program was cost-effective, creating, on average, one job for one year for an investment of €24,000. The employment gains are detectable after nine months and are accompanied by an unemployment reduction amounting to half of the job creation. Employment grew predominately in the directly affected industries.

They addressed the endogeneity problem (governments may target regions that are hardest hit by the recession) by exploiting the legal structure of the stimulus bill. The bill prescribed that 65 percent of funds had to be spent on investments in the educational infrastructure, in particular on improving the energy efficiency of existing buildings. This implies that the local scope for investments was closely linked to the historically predetermined number of schools. Since the number of schools is a predetermined stock variable and thus unrelated to the magnitude of the recession in a county, it constitutes an ideal instrument for local investments. To put the cost of one job per year in perspective, the average labor costs in the construction industry was at least €45,000. The employment gains translate into a fiscal multiplier of about 1.5. 

Friday, April 16, 2021

COVID-19 related economic scarring

The IMF’s WEO April 2021 includes a chapter on the possible persistent effects of the pandemic on economic activities (scarring). It notes that the emerging markets and low-income countries are expected to face greater scarring due to their limited policy space to launch relief measures for struggling households and firms. It argues that the crisis could result in substantial and persistent damage to supply potential and extend scarring due to diminishing labor force participation, bankruptcies, and disruption of production networks. The longer the recession, the more likely the effects will be permanent, especially in countries with the prevalence of small firms and shallow capital markets. Persistent supply disruptions could result from the loss of economic ties in production and distribution networks as job destruction and firm bankruptcies increase— these tend to lower productivity growth and slowdown capital accumulation. These could dampen investment and employment, and cripple productivity growth for an extended period of time. 

The IMF states that although financial instabilities have been largely avoided this time and the spillovers of the pandemic’s initial impact on high contact-intensive service sectors are limited, the scale of the impact could still represent a large shock to the economy. It estimates that the global output in 2024 could be 3% lower than the anticipated pre-pandemic output. However, the degree of scarring varies by country. Policymakers could limit scarring by providing support to the most-affected sectors and workers while the pandemic is ongoing. To address long-term GDP losses, countries need to focus on remedial policies for the setback to human capital accumulation, boost investment, and support reallocation of workers and firms (retraining, reskilling, and insolvency procedures).


The COVID-19 pandemic resulted in a combination of supply and demand shocks. Pandemic-induced lockdowns reduced effective productive capacity as some firms were forced to close or operate at below capacity than usual times, and some had to reorganize production on account of physical distancing between workers, which in turn lowered productivity. The initial supply shocks spilled over to other sectors through production networks. Meanwhile, demand decreased due to reduced mobility and as precautionary savings increased amidst heightened uncertainty. The initial supply shock also led to a decline in demand as workers earned either less or were laid off outright, which decreased private savings.  

After recessions or health shocks in the past, technology adoption, employment, and capital accumulation suffered, leading to extended period of economic slowdown. For instance, unemployment continued to remain high and lowered labor force as discouraged workers exited the labor market. Extended period of unemployment affects skills deterioration, delays labor market entry for young workers, negatively affects educational achievement in the long-term (especially, parental job losses adversely affect children’s schooling and future labor market outcomes)— all affecting human capital accumulation. Similarly, recessions also dampen investment, slowing down physical capital accumulation, which affects productivity though slower technology adoption. Also, business bankruptcies permanently affect productivity due to the loss of firm-specific know-how. Decline in research and development, and increase in resource misallocation also affect productivity permanently. 

The pandemic has already caused some form of supply-side scarring from lower productive capacity and demand-side persistent preference shits. The report three particular features of the crisis on scarring:

1. Although lower than after the global financial crisis in 2008, the prospects for scarring from COVID-19 are substantial. This time there is relative financial stability following the COVID-19 shock thanks to large-scale fiscal and monetary measures. Previously, financial crisis resulted in deep recessions, which then led to persistent output losses. However, this time financial stress could easily build up as loan defaults increases after debt service moratoriums and several regulatory forbearances are phased out. These affect productivity, and efficiency of labor and capital inputs. 

Lower-skilled workers have seen a disproportionately large decline in employment and business exits of small businesses are increasing. 

2. Some sectors have not recovered after productivity shocks in the past and that the spillovers from COVID-19 shocks are still sizable (despite high-contact sectors are less central to production networks). Scars become persistent due to lower productivity growth and slower capital accumulation. 

Note that scarring in the labor market may be larger than in previous recessions because of permanent shrinkage of some high-contact sectors. For instance, some student in low-income countries may not be fully able to switch to virtual learning and this could have devastating implications on human capital accumulation. Similarly, physical capital shrinkage could also amplify scarring because of sector-specific idle capital in the case of high-contact sectors, and large corporate debt buildup that lowers investment by more leveraged firms. 

The pandemic related disruptions to upstream (from customers to focal sector of interest) and downstream (from suppliers to focal sector of interest) production networks could have knock-on effects on productivity of connected firms. Productivity could also suffer if small businesses close down in high-contact sectors but large companies strengthen their market power. The increased digitization and innovation in production and delivery processes could offset some of the adverse productivity shocks though. 

The report finds that adverse productivity shock (supply shock) in own sector results in 5% lower total gross value added for up to five years after the shock. Government spending shock is not statistically significant on total GVA. For spillover shocks, downstream effects are dominant, highlighting the importance of supply shocks arising from COVID-19. The ‘own effect’ is larger for high-contact sectors such as wholesale and retail trade, hotels and restaurants, entertainment and personal services, transportation, education, healthcare, and construction.  

3. Global losses are smaller than during the global financial crisis largely due to unprecedented policy support and contained financial stability risks. That said, medium-term output losses from the shock are still sizable, but they exhibit significant variation across economies and regions. The IMF estimates that the COVID-19 shock will lower world output by 3% in 2024 compared to the pre-pandemic projections (over the same period, output losses were 10% in the case of global financial crisis). However, emerging and developing economies will likely have deeper scars than advanced economies, thanks partly due to the larger pandemic-related fiscal responses in the latter and faster access to vaccines. Particularly, economies more dependent on travel and tourism, and those with larger service sectors, are expected to experience more persistent losses.  

Medium-term scarring is contingent on: (i) the path of the pandemic and associated containment measures, (ii) impact of the pandemic shock on high-contact sectors, (iii) adaptation capability of firms and workers to a lower-contact working environment and lower-contact transaction, and (iv) the effectiveness of policy response to limit economic damage.  

Depending on the level of fiscal space, the IMF recommends countries to 

  • Reverse setbacks to human capital accumulation and encourage employment by ensuring adequate resources for healthcare, early childhood development programs, education, worker retraining and investment in digital literacy, expansion of social safety nets, and support for displace workers.
  • Support productivity by allowing exit of nonviable firms, active labor market policies (help workers transition between jobs by retraining, public employment services, public work schemes, wage subsidies, and support for self-employment/micro-entrepreneurs), and facilitate resource reallocation (to improve labor mobility and reduce product market rigidities). Other measures include promotion of competition, innovation and technology adoption. 
  • Boost investment in infrastructure, particularly green infrastructure to help crowd-in private investment. Repairing corporate balance sheet to reduce debt overhand will also promote investment. Improved bankruptcy and debt restructuring mechanisms help to reallocate productive capital. 

Sunday, March 7, 2021

CBS projects Nepal's GDP to contract by 1.9% in FY2020 (using new base, FY2011=100)

On 4 March 2021, Nepal’s Central Bureau of Statistics released national accounts statistics that were rebased to 2010/11 (FY2011) from earlier 2000/01. According to the latest rebased national accounts statistics, the size of economy was about USD 34 billion in FY2020 (USD 32.4 billion without latest rebasing). Likewise, the new base yields nominal GVA 5% higher than nominal GVA under the old base. In FY2011, the rebased GDP was USD 21.6 billion, which is 14.3% higher than USD 18.9 billion under the old base. Since the nominal GDP is now going to be larger than in the previous FY2001 base series, several statistics related to fiscal, monetary and external sectors that are expressed as a share of GDP could see slight downward revision. FYI, fiscal year (FY) starts from mid-July of t-1 year and ends on mid-July of t year (for instance, FY2020 refers to the period between mid-July 2019 and mid-July 2020). 


The use of new base (FY2011=100) has yielded different GDP growth estimates. The CBS has released data spanning FY2011-FY2020. The last two years are revised and provisional estimates. So, these will be revised next year too. For now, GDP is estimated to contract by 1.9% in FY2020 (FY2001=100 base showed it would have grown by 2.3%) as the impact of COVID-19 disrupted labor, capital, supply chains and healthcare services, resulting in employment losses and business disruptions. A country-wise lockdown in Nepal started on 24 March 2020 (which is towards the end of second month of third quarter) and lasted well into the fourth quarter. Lockdown was relaxed in September. The country did not fully open at least until the end of 2020 (international travel remains restricted though). 

Agricultural sector is expected to grow at 2.2%, down from 5.2% in FY2019, owing to delayed monsoon, shortage of chemical fertilizers, use of substandard seeds, and an armyworm invasion. The lockdowns disrupted agricultural labor, harvest and supplies too. This, however, is the only silver lining as the other two sectors are expected to contract. In an op-ed published in The Kathmandu Post on 19 October 2020, I argued that GDP in FY2020 will contract.

Industrial output is projected to contract by 4.2%, down from 7.4% growth in FY2019, as mining and quarrying, manufacturing, and construction activities were battered by the lockdowns and subdued demand. However, with the addition of new hydroelectricity in the national grid and improvements in water supply, electricity and utilities subsector is expected to grow by 25.6%. 

Services output is projected to contract by 3.6%, down from 6.8% growth in FY2019 owing to the severe impact of lockdowns and supplies disruptions on wholesale and retail trade, transportation and storage and accommodation and food service activities.  These are high contact services activities. They together account for about 22% of GDP. Within services sector, public administration and defence, and mandatory social security payments are expected to grow at a rate higher than in FY2019. This reflects the increased government expenditure to support various temporary relief and income support measures for those affected by the pandemic. 

In the chart above also, notice that GDP growth reached a high of 9% in FY2017 as economic activities rebounded (plus some base effect) after the devastating 2015 earthquakes and 2016 border blockade. 

On the expenditure side, while consumption is expected to grow at 4%, slightly lower than 5.8% in FY2019, investment and net exports are expected to contract. Investment (gross capital formation) is expected to decrease by 21.2%, largely contributed by a fall in private investment. Public gross fixed capital investment is expected to contract by 5.4%, continuing on a contractionary trend since FY2018 as public capital spending continues to fall short of budgeted amount. Private gross fixed investment is expected to contract by 2.8%, down from 20.8% growth in FY2019, as the lockdowns created adverse environment for private sector. A larger export contraction compared to import contraction is expected to lead to overall contraction of net exports.

Here are some observations regarding the rebasing of national account statistics.

First, rebasing is a welcome development given that it helps to capture some of the structural changes in an economy over a period of time. It often includes inclusion of more of existing, new or disaggregated sectors, which usually happen in services sector as it tends to change more with time. The latest FY2011 series also incorporates recommendation of UN SNA 2008 (in place of SNA 1993) and adopts updated industrial division classification. So, it is inching toward more data accuracy and consistency with international practices. This is the fifth rebasing of national accounts statistics, following rebasing in FY1965, FY1975, FY1985, FY1995, and FY2001. I hope the CBS releases national accounts statistics for years prior to FY2011 using the new base so that historical comparison is consistent.

The new base series includes 18 subsectors and is updated to international standards industrial classification (ISIC) rev.4. The old base series included 15 subsectors and was consistent with ISIC rev.3.1. The value of economic activities each year (GDP) under the new base is higher for three reasons: (i) wider coverage of economic activities all subsectors except public administration and defense and other services (arts, recreational, etc); (ii) changes due to methodology especially for financial intermediation, and real estate and professional activities; and (iii) change due to classification especially for real estate and professional activities, public administration and defense, and other services. Overall, changes due to methodology, and wider coverage and use of new ratios accounted for 0.48% and 13.58%, respectively, increase in GDP in FY2011 under the new base. 

Agriculture, forestry and fishing is now clubbed as one sector in the new series. In the industry sector, electricity, gas and water subsector is divided into two subsectors: electricity, gas, stream and air conditioning supply; and water supply, sewerage, waste management and remediation activities. So, the industry sector in the new base has five subsectors. Services sector is the one that has gone through most changes, particularly inclusion or expansion of new economic activities. Wholesale and retail trade now also has repair of motor vehicles and motorcycles. Hotels and restaurants subsector is now accommodation and food services activities. Transport, storage and communications is divided into two subsectors: transport and storage, and information and communication. Real estate, renting and business activities are now divided into three subsectors: real estate activities; professional, scientific, and technical activities; and administration and support service activities. 

Second, rebasing, to some extent, captures the structural changes in the decade between the rebasing. Between FY2001 and FY2011, the share of agriculture and industry sectors declined, but that of services sector increased. This confirms the unusual structural transformation whereby the decline in agriculture sector is picked up by the increase in services sector, bypassing the industrial sector. Moreover, the larger share of services sector is also due to wider coverage of economic activities and changes in methodology and classification. Even with this, wholesale and retail trade, and vehicular repair activities as a subsector accounts for about 15.2% of GDP, which is similar to the share of the entire industry sector (mining and quarrying; manufacturing; electricity, gas, steam and air conditioning; water supply, sewerage, and waste management; and construction). The massive post-earthquake reconstruction boosted mining and quarrying, and construction activities, leading to a slight uptick in the share of industry sector in GDP from FY2017 onwards. 

Third, rebasing increased the share of services sector in GDP and hence the severity of impact of the pandemic as well. The high contact services such as wholesale and retail trade, and repair activities; transportation and storage; and accommodation and food service activities were also the most affected by the lockdowns and social distancing norms. This contributed to the larger contraction of services sector in FY2020 and its eventual effect on GDP contraction.

Fourth, on the expenditure side, the rebasing exercise has reinforced the argument that consumption is higher than earlier reported. It is largely fueled by remittance income, which has drastically increased since FY2001. Investment, exports and imports were lower than expected. In FY2011, the share of consumption in GDP was 86% under old base but 92.9% under the new base. It increased to 91.1% of GDP in FY2020 under the new base with private consumption accounting for about 88% of total consumption. 

Gross capital formation, or investment in general terms, was markedly down in FY2011: 27.7% of GDP under new base compared to 38% of GDP under the old base. It increased to 31.3% of GDP in FY2020. Notice that under the old base investment was reported to be about 50.2% of GDP, but almost half of it was change in stocks, which is derived residually and hence includes statistical discrepancy/error as well. Under the new base, statistical discrepancy has been as high as 9.5% of GDP (in FY2018). It is estimated to be 4.6% of GDP in FY2020. Public investment is reported to be higher under the new base than under the old base but private investment is reported to be lower under the new base. Over years, while public investment, as a share of GDP, is declining (thanks to receding public capital spending absorptive capacity), private investment is increasing, reaching 23.9% of GDP in FY2020. 

Imports of goods and services are expected to be 28.4% of GDP under the new base as opposed to 32.9% of GDP under the old base in FY2011. Imports are expected to be 33.6% of GDP in FY2020 (under old base it was reported to be 40.1% of GDP). Exports of goods and services are expected to be about 6.7% of GDP in FY2020, down from 7.8% of GDP in FY2011. 

Fifth, using the new base gives a higher per capita GDP as GDP itself is revised upward. For instance, the value of goods and services produced in the country in FY2020 (or GDP) was USD 32.4 billion under the old base. It has increased to USD 33.9 billion under the new base, which means size of the economy increased by about USD 1.5 billion. Per capita GDP is now estimated to be USD 1134 and per capita GNI USD 1148 in FY2020. Per capita GNDI (which includes remittance inflows as well) was USD 1430 in FY2020 (or 126% of GDP). These are all in nominal terms. 

Since consumption is too high, gross domestic savings is automatically low. It dropped to 8.9% of GDP in FY2020 from 15.7% of GDP in FY2019. Gross national savings was about 35% of GDP in FY2020, down from 42.5% of GDP in FY2019. 

Sixth, since nominal GDP has increased, all other macro indicators expressed as a share of GDP have also been automatically revised downward. Tax revenue will be about 17.8% of GDP. There may not be much change in fiscal deficit as a share of GDP because expenditure will also be arithmetically lower. Current account deficit will now be around 0.8% of GDP. Merchandise exports and imports will be 2.7% and 29.7% of GDP, respectively in FY2020. Workers’ remittances would drop to around 22% of GDP in FY2020. Outstanding public debt in FY2020 was 36% of GDP (37.7% of GDP under the old base), up from 27.1% of GDP in FY2019.

Seventh, rebasing is a good exercise and needs to be done periodically. Let us hope that the CBS will publish national accounts estimates (both real and nominal) for years prior to FY2011 as well using the new base year. This is important to ensure correct comparison and interpretation. Creating a back series using the new base year is an important exercise for the statistics bureau. Otherwise, people will start reporting real GDP growth using old base year for up to FY2011 and then use the latest base year FY2011 onwards. 

***

The CBS also released quarter data for up to the first quarter of FY2021. The economy contracted, y-o-y in the last quarter of FY2020 by 15.4% and then further contracted by 4.6% in the first quarter of FY2021. The impact of COVID-19 and the lockdowns on the economy is clearly visible from the slump in GDP numbers in the two quarters. This has technically pushed the economy into recession as two consecutive quarters of GDP contraction is usually referred to as recession. This quarterly series is also based on the new base. The CBS has not released full related sectoral data and the chart below is from the presentation slides CBS uploaded in its website.. 

Sunday, February 28, 2021

COVID-19 and economic divergence

In its February 2020 G-20 Surveillance Note, the IMF notes that a global recovery hinges on making rapid progress against the pandemic and maintaining effective economic support until the virus is defeated. In addition to substantial income and liquidity support by advance economies plus secured access to vaccines, the divergence among advanced and EMDEs is already striking: over 50% of emerging market and developing economies that were converging toward advanced economies (in terms of GDP per capita) are now expected to diverge during 2020-22. 

While rich countries are securing vaccine supplies or commitment for future supplies and have deployed large fiscal and monetary measures, poor countries that have little fiscal space are grappling to secure access to vaccines. They need support to prevent setback in development gains, to maintain access to food and healthcare, and to invest in climate resilience and digital infrastructure. 

To durably end the pandemic, global cooperation is important, including in meeting the financing needs for COVAX facility so that several emerging market and developing economies have access to vaccines in an equitable manner. Well-targeted fiscal and liquidity lifelines and monetary policy support are essential until constraints are eased meaningfully. However, macroprudential tools should be used to contain rising financial risks.  

Some of the concerning issues outlined in the note are as follows:

  • Inequalities are deepening, vulnerabilities are building, and economic potential is affected. For instance, the most vulnerable people have been hit hard with respect to loss of employment, and access to education and health services. Among those hit hard are young, low-skilled, women and informal sector workers. About 90 million people are expected to fall into extreme poverty during 2020-21. Prolonged unemployment could erode skills and learning gaps may widen due to lack of access to online learning. 
  • Many businesses will have substantially higher debt as they exit the pandemic, and once liquidity and regulatory forbearance lifelines are withdrawn, bankruptcies are likely to rise. Meanwhile, the crisis is eroding bank capital buffers and increasing pockets of pre-existing vulnerabilities in the non-bank financial sector.
  • Higher public debt could constraints government response to react to future downturns and also crowd out investment if the differential between interest rate and growth turns less favorable. 
  • Growth outlook remains uncertain. A faster-than-projected immunization could lead to ¾ percent higher global output in 2021, with benefits mostly concentrated in advanced economies. If infections accelerate through 2021 and vaccination efforts go less smoothly than currently anticipated, global output could fall ¾ percent below the 2021 baseline, with losses concentrated in advanced economies. 
  • More intense and frequent weather-related disasters could amplify economic difficulties and social instability in vulnerable regions, triggering migration to the rest of the world. 

The IMF argues that a global recovery relies on global leadership by the G-20. Some of the key highlights are as follows:

  • Ensure vaccination is widely available to end the pandemic everywhere. Virus could mutate and new variants could spread if everyone is not covered in the vaccination drive. Many advanced economies have procured enough supplies to more than cover their population, but many poorer economies are struggling to procure enough. G-20 must ensure that low- and middle-income economies get access to safe and effective vaccines, including boosting funding for COVAX facility, assist in funding logistics for vaccine delivery, and assisting in treatments, therapies, and tests to contain outbreaks. 
  • Monetary policy should remain accommodative in most economies because economic disruptions are ongoing, unemployment is high, and inflation expectations remain subdued. Employing macroprudential tools to address risk to financial vulnerabilities while maintaining monetary policy measures to support growth are essential in the medium-term. Access to bilateral central bank swap lines can help to maintain access to liquidity and financial stability in some economies. However, for economies facing high inflationary pressures, some withdrawal of monetary support may be warranted. Uneven global recovery may mean unintended spillovers as some country being to withdraw policy support. In this situation, clear communication by central banks in advanced economies and strong policy frameworks in emerging market economies may be helpful.
  • With unemployment still high, it is important to maintain fiscal support where possible (if fiscal space allows) to help the economy return to pre-existing income trends faster. In economies where vaccine may not be widely available and fiscal space is constrained, careful targeting of support to the most vulnerable, including reallocation of spending within the budget envelope, may be a viable option. It is important to avoid undue bankruptcies that could deteriorate employment losses. A credible medium-term fiscal framework that balances the need for short-term support against medium-term fiscal sustainability is needed, especially for economies with high debt and risks of increasing financing costs. 
  • With increasing vaccination and economic recovery, policy support should be transitioned to cater to the needs of the post-pandemic world. For instance, training and reskilling of unemployment people, investments in healthcare and education, and enhanced social protections will be helpful. For businesses, support should prioritize viable firms, restructuring and efficient out-of-court settlements and bankruptcy procedures so that resources and capabilities are not lost or left idle. 
  • Ensure a strong, green, and inclusive recovery. First, increase public infrastructure investment focusing on greening the economy to boost demand and strengthen resilience. Global economic boost is high during a time of economic slack if economies synchronize their spending while monetary policy remain accommodative. Agreement on mechanism to price externalities will be helpful, particularly forward guidance for phased-in, steadily rising carbon prices to meet emissions targets. Carbon pricing could be a part of a strategy to restore stronger fiscal finances. 
  • Promoting investment in the digital economy will help limit human capital erosion and strengthen inclusion. Ensuring widely accessible broadband internet helps to expand government service provision, facilitate remote learning, and create options for firms to expand their customer base. Digitization also helps to strengthen financial inclusion, and support convergence. Complementary reforms to ease barriers to entry can help strengthen innovation and investment. 

Saturday, February 27, 2021

Indian economy to grow by 0.4% in Q3 FY2021 but contract by 8% in FY2021

According to the latest estimates released by NSO, the Indian economy grew y-o-y by 0.4% in the third quarter of FY2021 (October to December 2020) after contracting by 24.4% and 7.3% in the first and second quarters, respectively. GVA growth was 1.0%. It indicates a gradual recovery upon unlocking of the economy following severe disruptions to economic activities and livelihoods due to the COVID-19 pandemic. The economy grew by 3.3% in Q3FY2020. 

While agriculture and industry sectors are projected to grow (y-o-y) by 3.9% and 2.7%, services sector is projected to contract by 1%. A bountiful harvest due to favorable monsoon and availability of agricultural inputs including abundant labor force that reverse migrated to the villages after the lockdowns contributed to the strong agricultural sector performance. In fact, rice output grew by 2% in Q3 FY2021 compared to 0.1% in the corresponding quarter in FY2020. 

Industrial activities began to recover after five successive quarters of negative growth starting Q2FY2020. Within industry sector, mining and quarrying contracted by 5.9%, but manufacturing, electricity and other utilities, and construction activities continued recovery. The corresponding IIP data for industry sector show that mining contracted y-o-y by 4.4% and metallic minerals by 15.9%. However, manufacturing and electricity grew by 1.2% and 6.7%, respectively. That said, the cumulative data up to the third quarter show that all IIP broad sectors actually contracted in FY2021 compared to FY2020.  

Within services sector, while financial, real estate and professional services recovered trade, hotels, transport, communication, and public administration and defense activities continued on contractionary trend. Travel and tourism industry still continues to be affected by the pandemic-related restrictions and consumer apprehension.

On the demand side, private consumption growth remains strong but public consumption growth is moderating. Gross fixed investment grew at a solid pace of 33.0% y-o-y compared to 32.3% in Q3FY2020. Exports of goods and services grew by 21.2% but imports decreased by 0.8%. So, it is strong private consumption and investment, partly assisted by the fiscal stimulus and subsidies provided by the government, that is driving growth. This is reflected in the supply-side data as strong agricultural sector growth and recovery of industrial sector activities. 

The NSO also released second advance estimates, which show notable revisions in the benchmark estimates released in the first advance estimates. The extrapolation is based on information available during the first nine months of the fiscal year. It shows that the economy will likely contract by 8.0% in FY2021, steeper than in the first advance estimate. The economy is expected to grow by 4.0% in FY2020.

While agriculture sector is expected to grow by 3.0% in FY2021, industry and services sectors are expected to contract by 8.2% and 8.1%, respectively. Except for electricity and other utilities, other sub-sectors in industry sector are expected to contract sharply (over 8%). The disruption to travel and tourism activities is expected to contract trade, hotels, transport and communications activities by 18.0%.  

Friday, October 30, 2020

Fiscal policies to address COVID-19 pandemic

In its latest Fiscal Monitor (October 2020), the IMF argues for flexible fiscal measures to respond to lockdowns and tentative reopenings, and facilitation of structural transformation to a new post-pandemic economy. The report outlines a roadmap for the overall fiscal strategy to promote a strong recovery. The idea is to facilitate the transformation to a more resilient, inclusive and greener economies. The IMF recommends full transparency, good governance, and proper costing of all fiscal measures, especially given their size, exceptional nature, and speed of deployment.

Going forward, interest rates will remain low for a long time in advanced and some emerging market economies due to high levels of precautionary savings by households and limited private investment amidst the uncertainties. It means there is scope and motivation for fiscal policy (thanks to negative interest-growth differential) to remain a crucial and powerful tool for recovery. For instance, scaling up of quality public investment will boost employment and economic activities, crowd-in private investment, and absorb excess private savings without increasing borrowing costs. Some emerging market economies and low-income developing countries that face tight financing constraints may need to reprioritize expenditures, enhance efficiency of spending, and seek further official financial support and debt relief.  

On the nature of fiscal policy during and after the pandemic, the IMF recommends:

  • No premature withdrawal of crucial household and business support measures
  • Ensure social protection systems are targeted and able to deliver benefits to vulnerable people
  • During the recovery phase, help workers find new jobs and facilitate vulnerable firms to reopen
  • Support structural transformation toward the post-pandemic recovery including building resilience against future epidemics and other shocks. Policies to ensure that all people have access to basic goods (food) and services (health and education) are useful. Similarly, increasing carbon pricing and catalyzing investment in low-carbon technologies would help reduce emissions.
  • When the pandemic is under control, focus on addressing the legacies of the crisis such as elevated private and public debt levels, high unemployment, and rising inequality and poverty.
  • Countries with limited fiscal space should consider increasing progressive taxation and ensuring that highly profitable firms are appropriately taxed. This should be a growth-friendly and equitable adjustment.
  • Develop well-resourced and better-prepared healthcare systems, expand digital transformation, and address climate change and environmental protection. 

Recovery strategy

To boost immediate-term growth, the IMF recommends transfers and public investment, which when faced with uncertainty combined with very low interest rates, weak private investment, and a gradual erosion of public capital stock over time yield a high fiscal multiplier. The fiscal response strategy depends on at what stage of the recovery a particular country is in, i.e. lockdown, partial reopening or post-pandemic phases. These generally include the following

  • Lockdown phase: The objective is to save lives and livelihoods by continuing projects where safe (especially maintenance/repair).
    • Start planning or reviewing portfolio of planned and active projects
  • Partial reopening phase: The objective is to ensure safe reopening and to provide lifelines and targeted support. 
    • Public investment could focus on job-rich projects, reassess priorities and prepare pipeline
    • Maintenance works and ready for implementation projects should be the priority
    • Review, reprioritize and restart feasible projects put on hold, plan for new projects or prepare pipeline of appraised projects that can be implemented in the next two years
  • Post-pandemic phase: The object is to transform to a more inclusive, smart and sustainable economy. 
    • Depending on fiscal space, countries could implement large, transformational projects with large long-term multiplier in healthcare, climate change adaptation and mitigation and digitization sectors.
    • Strengthen project planning, budgeting, and implementation practices to improve public investment efficiency

Fiscal multiplier

The pandemic focused fiscal strategy calls for strengthened public investment management practices and governance to avoid delays, cost overruns, and disappointing project execution. Countries facing tight fiscal conditions could borrow at a low interest rates, which are expected to remain low through the medium-term. 

In advanced and emerging market economies, fiscal multiplier can be as high as 2 in two years. The IMF finds that increasing public investment by 1% of GDP in these economies would create 7 million direct jobs, and between 20 million and 33 million jobs indirectly. Similarly, GDP could grow by 2.7%, and private investment by 10%. The estimate is based on an empirical exercise covering 72 AEs and EMs with data on economic uncertainty regarding GDP forecasts (proxied by disagreements among forecasters). 

Public investment has larger short-term multipliers than public consumption, taxes or transfers. Macroeconomic conditions, institutional quality, and the quality of investment undertaken affect the size of multiplier. 

  • First, higher levels of public debt could yield lower fiscal multipliers if deficit-financed investment leads to greater sovereign spreads thus higher private financing costs (essentially, crowding-out the private sector). 
  • Second, if an economy faces supply constraints, then fiscal multipliers tend to be smaller (social distancing measures limit output capacity). 
  • Third, uncertainty over the trajectory of the virus and the economy could affect multiplier if private spending does not react to a fiscal stimulus (due to uncertainty and precautionary savings). Alternatively, multiplier could be higher if private spending reacts positively to higher public investment amidst mounting uncertainties. 
  • Fourth, weak balance sheet of firms (as they are unable to repay debt) and default risks limit their investment and hence the size of fiscal multiplier. 

Generally, multipliers tend to be larger in countries less open to trade because low propensity to import reduces leakage of the demand gains to other countries. Similarly, multipliers tend to be large in countries with fixed exchange rate regimes or where central banks are facing an effective lower bound. Also, when resources are underutilized (like in recessions), fiscal multipliers tend to be high – could be through direct public investment or through a combination of direct public investment and crowding-in of private spending through confidence boosting measures. 


Crowding-in private investment is possible in communications and transport (to respond to healthcare crisis), and construction and manufacturing (during recovery). Investment in health and education, and digital and green infrastructure can improve connectivity, economy-wide productivity, and resilience to climate change and future pandemics. Right government policies and initial investment can crowd-in private investment when faced with uncertainties.

 
Sizable fiscal support

The IMF notes that fiscal actions in response to COVID-19 amounted to $11.7 trillion (12% of global GDP) as of 11 September 2020. Half of this was additional spending or foregone revenue (such as temporary tax cuts and liquidity support including loans). In 2020, government deficits will likely surge by an average 9% and global public debt will approach 100% of GDP. Sizable discretionary support, a sharp contraction in output and an ensuing fall in revenues along with a rise in expenditure (beyond preexisitng automatic stabilizers) have increased government debt and deficits. 


Fiscal space

The ability of countries to respond to the pandemic is determined in part by their fiscal space, and by public and private debt levels. In advanced economies, massive liquidity provision and asset purchases by central banks have facilitated fiscal expansions. In some low-income countries, financing constraints have been high due to debt distress. 

Countries with limited fiscal space need to weigh in the benefits, costs and risks of additional fiscal support measures in the face of limited fiscal space. Evidence so far suggest that public health policies that quickly contain the spread of the disease also allowed for an earlier and safer reopening, restoration of confidence, and economic recovery. 


Popular fiscal support measures included the following:

  • Household income support (targeted cash transfers or/and in-kind transfers, unemployment benefits/stimulus checks)
  • Employment support (wage subsidies, hiring or retention subsidies)
  • Tax support measures (temporary tax deferrals, social security payments, income tax cuts, progressive tax, increase in excise duty, VAT refunds, utility subsidies)
  • Liquidity support (loans, guarantees, equity injections/solvency support, debt restructuring) 
  • Support for innovation, green growth and digitization

Financing public spending

Some EMDEs have met increasing financing needs from borrowing internationally, drawing down buffers or extrabudgetary funds (India) or sovereign wealth funds (Chile, Russia), purchasing of government debt by central banks through quantitative easing (many AEs and some EMs), and increasing taxes (especially fuel excise tax in India and VAT rate in Saudi Arabia). Low income countries are relying on external assistance (grants or concessional loans).

Fiscal risks: Fiscal risks are high. They stem from

  • A protracted economic downturn (private sector demand may remain subdued, bank balance sheets may deteriorate, high fiscal resources needed to support and retain unemployed workforce) 
  • Tightening global financial conditions (rapid growth of sovereign debt and nonfinancial corporations debt expose countries to sudden change in financing conditions, especially borrowing costs, and subsequently issues with sustainability of corporate credit and sovereign debt)  
  • Commodity market volatility (price fluctuations impact commodity exporters and importers differently)
  • Contingent liabilities (new guarantees increase liabilities and debt vulnerabilities)

Sunday, August 23, 2020

The impact of COVID-19 on Africa

Paul Collier explains how four shocks (drop in commodity prices, remittances, tourism, and international capital) due to the overarching COVID-19 shock are threatening Africa's progress.


Two in three jobs in sub-Saharan Africa are in the informal sector. There are no economies of scale or specialisation. Small is not beautiful, it is unproductive. Africa needs more companies capable of organising a workforce into specialised, collaborative teams, disciplined by competition. Yet even the firms that Africa has are bleeding from the economic impact of coronavirus.

This shock is not predominantly a result of Africa’s health crisis. The causes are the sharp downturns in advanced economies. Commodity prices have dropped and Africa is a major net exporter.

Senegal and Ethiopia are major recipients of remittances from citizens working abroad. Normally, these rise during a domestic crisis, but in this global emergency Africa’s diaspora are losing their jobs. This also hits the most desperate places such as Yemen.

Finally, the retreat of international capital to safety is hitting hardest the countries that were most promising for investors. Ghana was attracting US pension fund money and major companies such as Volkswagen and Bosch. All four shocks are eroding Africa’s scarce organisational capital and are likely to persist for the medium term.


Impact of COVID-19 on the external sector

The IMF’s latest external sector report highlights the state current account balance amidst the global trade and supplies disruptions caused by the COVID-19 pandemic. The pandemic has sharply curtailed global trade, lowered commodity prices, and tightened external financing conditions. 

According to the report, the world had a current account surplus of about 2.9% of world GDP in 2019. About 40% of current account surpluses and deficits were excessive in 2019. Euro area had larger-than-warranted current account balances, but the US, the UK and Canada had lower-than-warranted current account balances. China’s external position remained unchanged and they were broadly in line with fundamentals and desirable policies. Currency movements were generally modest, but with preexisting vulnerabilities/fundamentals in EMDEs (large current account deficits, a high share of foreign currency debt, and limited international reserves or reserves adequacy). 


The IMF forecasts current account surplus narrowing by 0.3% of world GDP in 2020, thanks to large fiscal expansion but offsetting increases in private savings and lower investment (precautionary move by household and business sectors). Economies dependent on severely affected sectors such as oil and tourism, and remittances have been hit hard.  There was a sudden capital flow reversal and currency depreciations in EMDEs as financial market sentiment deteriorated during the initial days of the crisis. Unsurprisingly, global reserve currencies appreciated as investors looked for safe haven amidst the financial stress. There is some unwinding now though, reflecting exceptional monetary and fiscal policy support. 

Current account balances in 2020 will be affected by 

  • Contraction in economic activity (lower output/export and import demand)
  • Tightening in global financial conditions
  • Lower commodity prices (oil, metals, food, raw materials)
  • Contraction in tourism
  • Decline in remittances 

The number of export restrictions in 2020 is higher than during the global financial crisis, but the number of import restrictions is lower. Sectors such as pharmaceutical and medical supplies, made-up textile articles, wearing apparel, rubber products, and ethyl alcohol and spirituous beverages faced the most export restrictions.  

Some EMDEs with preexisting vulnerabilities (large current account deficits, a high share of foreign currency debt, and limited international reserves) might face high risk of an external crisis (with capital flow reversals and currency pressures) if risk sentiment deteriorates. 

A second wave of the pandemic could lead to tightening of global financial conditions, narrow the scope of EMDEs to run current account deficit, further reduce current account balances of commodity exporters, and deepen the decline in global trade. Up to now, swift response of central banks (policy rate cuts, liquidity support, asset purchase programs, and swap lines offered by the US Federal Reserve) and expansionary fiscal policy have contributed to an easing in global financial conditions. EMDEs experienced sudden capital flow reversals in late February and march but then stabilized in most cases with even modest inflows in selected economies. 

Near-term priority

The near-term priority should be to provide relief and promote economic recovery. 

  • Flexible exchange rates should be allowed to adjust as needed to absorb external shocks (especially a fall in commodity prices or tourism). 
  • Official financing to ensure continued healthcare spending is required for those economies experiencing disruptive balance of payments pressures and without access to private external financing. 
  • Tariff and non-tariff barriers to trade, especially on medical equipment and supplies, should be avoided. 
  • Countries with adequate forex reserves could engage in exchange rate intervention to avoid disorderly market conditions and limit financial stress. 
  • Countries with limited reserves and facing reversals of external financing, capital outflows management measures could be useful (but these should be used to substitute the warranted macroeconomic and structural policy actions).

Medium-term priorities

Preexisting economic and policy distortions may persist or worsen over the medium-term.

  • Fiscal consolidation over the medium term would promote debt sustainability, reduce current account gap, and facilitate raising international reserves. Note that excess current account deficits in 2019 partly reflected larger-than-desirable fiscal deficits. 
  • Productivity-enhancing reforms would benefit economies with low export competitiveness. 
  • For countries with large current account surpluses after the COVID-19 pandemic, prioritizing reforms to encourage investment and discourage excessive private savings are warranted. In some instances, economies with large current account surpluses could discourage excessive precautionary savings by expanding the social safety nets. 
  • For economies with some fiscal space, emphasis on greater public sector investment would be helpful to narrow excess surpluses and to stimulate economic activities. 

Outlook for 2021

The outlook for 2021 is highly uncertain. Under a scenario where a second major global outbreak occurs in early 2021 (disruptions to economic activity is assumed to be half the size of the baseline in 2020, financing tightening of about one-half of the increase in sovereign and corporate spreads since the outbreak began in EMDEs, and relatively limited tightening of sovereign premiums for advanced economies),

  • Global trade is projected to decline by an addition 6%, global GDP decline by 5%, and oil prices to be higher by 12% compared to the baseline. 
  • Recovery in global trade will be underpinned by the need to rebuild the capital stock (investment goes up), and higher import intensity of exports. 
  • Emerging market economies will face higher borrowing costs, lower oil prices and subdued domestic demand – it will raise current account balances toward surplus. 
  • Net oil exporters will face lower oil prices, which will reduce their current account balances.
  • Advanced economies will face relatively limited tightening in external financing conditions and greater fiscal policy space will mean lesser import compression than among EMs, leading to lower current account balances. 
  • So, capital will flow from EMs to AEs, highlighting the unequal impact of the crisis and the need for a global policy response. 
  • Under a faster recovery scenario, global trade rises by 4% in 2021 compared to the baseline. 

The report notes that the historical relationship between trade and the components of GDP/aggregate demand (or import-intensity-adjusted measure of aggregate demand, which basically is a weighted average of aggregate demand components in which the weights are the import content of each component computed from national accounts input-output tables) fully explains the expected global decline in trade of goods. A part of the impact of lower economic activity on trade is felt through global value chains. After the global finance crisis circa 2009, residual factors such as rising protectionism explained part of the fall in trade in goods and services as they could not be fully explained by the fall in economic activity alone. Services trade contraction in 2020 is more severe than what could be expected based on the historical relationship between services trade and aggregate demand, suggesting the role of special factors such as travel restrictions. 

The IMF determines excessive current account balances by comparing the actual current account (stripped of cyclical and temporary factors) and the current account balance that is consistent with fundamentals and desirable policies. The resultant gap reflects policy distortions (e.g., higher current account balance than implied by fundamentals and desirable policies correspond to a positive current account gap, whose elimination is desirable over the medium-term). The IMF also considers REER that is normally consistent with the assessed current account gap. A positive REER implies an overvalued exchange rate. Other indicators that are considered are financial account balances, international investment position, reserve adequacy, and other competitiveness measures such as the unit-labor-cost-based REER and staff views on the current account gap using country-specific trade elasticities. 

On economic and financial fundamentals, and desired policies, advanced economies with higher incomes, older population, and lower growth prospects have positive current account norms. EMDEs tend to have negative current account norms because they are expected to import capital to invest and exploit their higher growth potential.

Monday, August 17, 2020

INR 1 trillion Agriculture Infrastructure Fund in India

On August 9, PM Modi launched the Rs 1 lakh crore Agriculture Infrastructure Fund (AIF) to be used over the next four years. 

This article in Mint explain what it is about: 

The scheme will provide better warehousing and cold storage facilities for farmers, Modi said, adding, new jobs will be created as food processing and post-harvest facilities are set up in rural areas. The scheme will enable startups to scale up their operations and India to build a global presence in organic and fortified food, he said. The fund was launched with ₹1,128 crore of new loans disbursed to more than 2,200 cooperative societies. During the event, the Prime Minister also transferred ₹17,100 crore to farmers under the PM-Kisan direct income assistance scheme.

Under the infrastructure scheme—part of the federal government’s Atmanirbhar Bharat package announced in May—banks and financial institutions will provide ₹1 trillion in loans to cooperative societies, farmer producer companies, self-help groups, entrepreneurs, startups and infrastructure providers. The objective is to provide medium to long-term debt financing for setting up of post-harvest infrastructure and community assets for marketing of farm produce. According to the guidelines, all loans up to ₹2 crore will be disbursed with a 3% interest subsidy. The loans will be disbursed over four years— ₹10,000 crore in 2020-21, and ₹30,000 crore in the next three years.

This article in The Indian Express explains how it will be implemented and the potential roadblocks.

The fund will also be used to provide loans, at concessional rates, to FPOs and other entrepreneurs through primary agriculture credit societies (PACs). NABARD will steer this initiative in association with the Ministry of Agriculture and Farmers Welfare.

“The fund is a major step towards getting agri-markets right,” writes Ashok Gulati, the Infosys Chair Professor for Agriculture at ICRIER. But he points out some missing parts of the puzzle. Firstly, unless NABARD ensures that FPOs get their working capital at interest rates of 4 to 7 per cent — like farmers get for crop loans — the mere creation of storage facilities will not be enough to benefit farmers. “Currently, most FPOs get a large chunk of their loans for working capital from microfinance institutions at rates ranging from 18-22 per cent per annum. At such rates, stocking is not economically viable unless the off-season prices are substantially higher than the prices at harvest time,” he writes. The second missing item is the future of the agri-futures markets. A vibrant futures market is a standard way of hedging risks in a market economy. Several countries — be it China or the US — have agri-futures markets that are multiple times the size of those in India.

Saturday, May 23, 2020

Actual fiscal stimulus in India

On 12 May 2020, Prime Minister Narendra Modi announced a special economic package worth INR 20 lakh crore (INR 20 trillion or about USD 267 billion), which taken together with the earlier announcements by the government and RBI is equivalent to about 10% of GDP, with a focus on a self-reliant India (Atmanirbhar Bharat). On 26 March 2020, the government had announced an economic relief package (PMGKP) worth INR 1.7 lakh crore while the RBI offered liquidity support of INR 3.7 lakh crore in March and INR 2 lakh crore in April. 

The Atmanirbhar Bharat Abhiyan (ABA) has five pillars and will focus on land, labor, liquidity, and laws.
  1. Quantum jump in economy 
  2. Modern infrastructure
  3. Technology-driven system/reforms
  4. Vibrant demography
  5. Strong demand 
The main idea is to build back better so that the eventual economic recovery is better than before and India is better positioned to respond to any future health or natural crises. Some of the measures (such as direct cash transfers and food subsidy) are designed to negate the effect of crisis such as COVID-19. The reform measures will not only enhance efficiency across sectors, but also ensure quality and push India towards a self-reliant economic regime. 

The government is aiming for bold reforms in supply chain in agriculture, rational tax system, simple and clear laws, competent human resource, and a strong financial system. Make in India campaign will benefit from these reforms as the emphasis is on meeting demand locally but competitively. The expectation is that these measures will lead to the emergence of confident and resilient India that depends on its strengths and also integrates with the global economy. 

Following up on PM Modi’s announcement, on 13 May 2020, Finance Minister Nirmala Sitharaman, provided details, in five tranches (Part 1, Part 2, Part 3, Part 4, and Part 5), of the comprehensive package. 

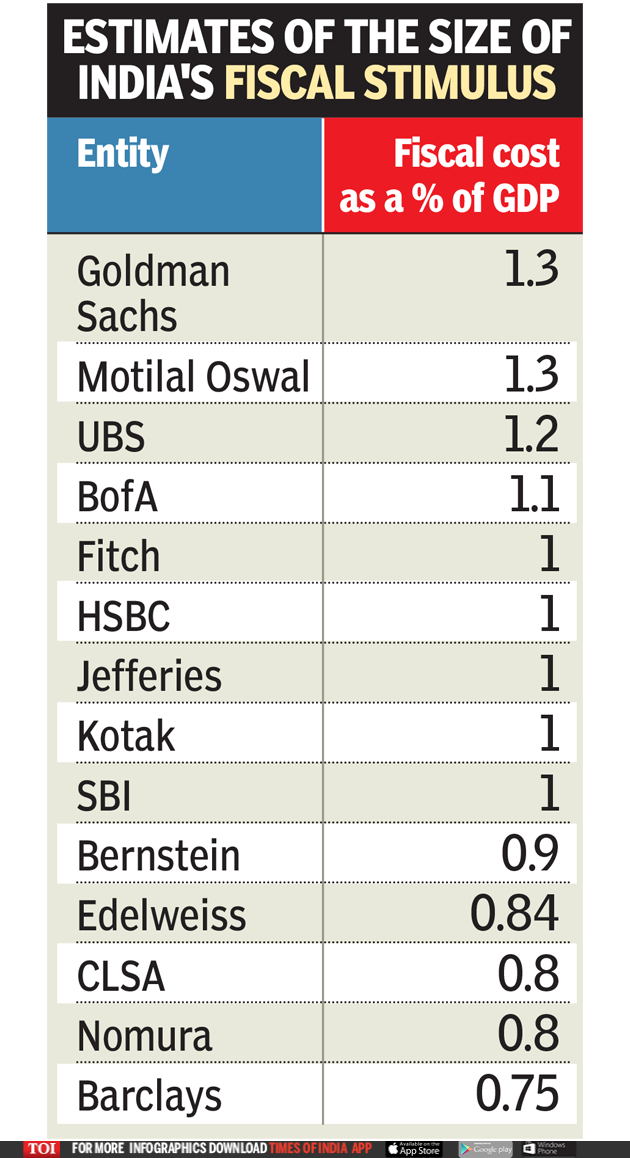
The extra fiscal spending will be a fraction of INR 20 trillion as most are related to providing or leveraging liquidity, providing guarantees, and regulatory tweaks. The guarantees and backstops increase contingent liabilities on government, to the extent they are utilized. The following table gives an overview of the estimated fiscal cost or stimulus (1 USD = INR 75).

Self-reliant India movement economic package
Sectors
INR crores
USD billion
Fiscal stimulus or cost
Before May 13
Revenue loss due to tax concessions since 22 March
7,800
Tax relief
PMGKY
          170,000
22.7
102,600
Emergency Health Response Package
15,000
2.0
15,000
Total
192,800
25.7
Tranche 1-For businesses including MSMEs
MSMEs
Emergency collateral-free working capital facility
          300,000
40.0
Subordinate debt for stressed MSMEs
20,000
2.7
4,000
MSME Fund of Funds
50,000
6.7
10,000
EPF
Extend EPF support for 3 more months
2,500
0.3
2,500
Reduction in employer & employee contribution to 10% from 12% for 3 months
6,750
0.9
Tax relief
NBFCs/MFIs
Special liquidity scheme for NBFC/HFC/MFIs
30,000
4.0
Partial credit guarantee scheme
45,000
6.0
20% of loss if incurred
DISCOMs
Liquidity injection
90,000
12.0
Tax relief
TDS and TCS reduced by 25% for FY2021
50,000
6.7
Tax relief
Total
          594,250
79.2
Tranche 2-For poor, including migrants and farmers
Migrant workers welfare
Free food grains supply to migrant workers for two months
3,500
0.5
3,500
Farmers and small businesses
2% Interest subvention for 12 months for Shishu MUDRA loanees
1,500
0.2
if incurred
Credit facility for street vendors
5,000
0.7
if incurred
Extension of Credit Linked Subsidy Scheme under PMAY (Urban)
70,000
9.3
if incurred
Additional emergency working capital for farmers through NABARD
30,000
4.0
if incurred
Concessional credit to PM-KISAN beneficiaries
200,000
26.7
if incurred
Total
310,000
41.3
Tranche 3-Formalizaiton of Micro Food Enterprise (MFE)
Strengthen infrastructure logistics and capacity building
Agri Infrastructure Fund
100,000

100,000
Formalizaiton of Micro Food Enterprise (MFE)
10,000
10,000
Pradhan Mantri Matsya Sampada Yojana (PMMSY)
20,000
20,000
Animal Husbandry Infrastructure Development Fund
15,000
15,000
Promotion of herbal cultivation
4,000
4,000
Beekeeping initiatives
500
500
TOP to TOTAL
500
500
Total
150,000
20.0
Tranche 4-New horizons of growth- Structural reforms in eight sectors
Social infrastructure VGF
8,100
8,100
Total
8,100
1.1
Tranche 5-Government reforms and enablers
MGNREGS
40,000
40,000
Total
40,000
5.3
RBI measures-actual
801,603
106.9
Grand total
2,096,753
279.6
335,700
Share of total
16.0
FY2020AE NGDP
2,998.6
22489420
Share of NGDP FY2020AE
1.5

When the size of fiscal stimulus is expressed as share of GDP, then one confusion is which year’s nominal GDP to use. If folks use FY2020 advanced estimate of nominal GDP, then it may not be correct because nominal GDP is sure to decline as the advance estimate was released before COVID-19 pandemic. But then, if folks revise FY2020 nominal GDP downward then the size of fiscal stimulus as a share of GDP will increase compared to FY2020 AE. If folks are using FY2021 nominal GDP forecast, then the variability in size of fiscal stimulus is unsurprising. Furthermore, note that some of the fiscal stimulus may not be realized in FY2021 itself. So, expressing fiscal stimulus as a share of GDP is not uniform across estimates by different organizations. That said, most of the estimates are between 1-2% of GDP. 

While some argue that the economic package is inadequate to address the economic challenges, other counter that it is appropriate for the time being.