Showing posts with label Trade. Show all posts

Monday, June 26, 2023

Medium-term power deal between India and Nepal

On 23 May 2023, Nepali and Indian authorities signed a 5-year (medium-term) agreement that will allow Nepal to sell an additional 200 MW of hydroelectricity to India. This is in addition to the 452.6 MW that Nepal already has permission to sell to India. More electricity export to India will mean more export revenues to Nepal. The new agreement applies to wet season only (from June up until November). In June 2023, during PM Dahal's visit to India, Nepali and Indian PMs agreed to a long-term energy deal, which targets 10,000 MW of electricity import by India in 10 years.

Excerpts from The Kathmandu Post:

The state-owned power utility and NTPC Vidyut Vyapar Nigam Limited (NVVN) of India signed an agreement on May 23, paving the way for the Indian company to purchase 200MW of electricity from Nepal for five years. The agreement was reached between the two sides just ahead of Prime Minister Pushpa Kamal Dahal’s state visit to the southern neighbour from May 31 to June 3.

The five-year agreement which the authority describes as a ‘medium-term’ power sale deal, means that the power utility will be securing the market for its 200MW of power. This deal is outside the existing quota of 452.6MW.After the Indian government approves a list of hydropower projects that Nepal has forwarded for exporting electricity under this mechanism, the selling will begin. Based on an agreement reached with NTPC Vidyut Vyapar Nigam Limited (NVVN), the prices the NEA will be receiving will be modest. The NEA will receive a net tariff of INR 5.25 (Rs8.40) per unit after trade margin, transmission losses and transmission charges.

Nepal has been selling its excess power in India’s day-ahead market since November 2021. The prices in the market fluctuates on a daily basis so the NEA’s sales income changes accordingly. The southern neighbour has so far allowed Nepal to sell 452.6MW of power in the Indian market.

Tuesday, January 17, 2023

High cost of geoeconomic fragmentation

Geoeconomic fragmentation, a policy-driven reversal of global economic integration, may be caused due to trade restrictions, barriers to the spread of technology (technology diffusion), restrictions on cross-border migration, reduced capital flows, and a sharp decline in international cooperation. These will affect various segments of the population and country differently. For instance, lower income consumers in advanced economies will lose access to cheaper imports, and economies heavily reliant on trade will suffer and per capita income catch up becomes challenging and adjustment costs rise.

According to a new IMF staff discussion note, the cost to global output from trade fragmentation could range from 0.2 percent (in a limited fragmentation / low-cost adjustment scenario) to up to 7 percent of GDP (in a severe fragmentation / high-cost adjustment scenario); with the addition of technological decoupling, the loss in output could reach 8 to 12 percent in some countries.

The IMF recommends a pragmatic approach to increasing geoeconomic fragmentation. These include strengthening international trade system including diversification of supply; helping vulnerable countries deal with debt as fragmentation makes it harder to resolve sovereign debt crises if key official creditors are divided along geopolitical lines; stepping up climate action including setting a floor on international carbon price and innovative use of public balance sheets—such as credit guarantees, equity and first-loss investments— to help mobilize funds for private financing. 

About 15 percent of low-income countries are already in debt distress and an additional 45 percent are at high risk of debt distress. Among emerging markets, about 25 percent are at high risk and facing default-like borrowing spreads.

Wednesday, January 4, 2023

India: Recent developments and economic outlook

In its 2022 Article IV consultation report on India, the IMF noted that the economy rebounded strongly from the pandemic-related downturn, supported by fiscal policy targeted at vulnerable groups and to mitigate the economic impact of commodity price increases. Front-loaded monetary policy tightening is addressing elevated inflation and a robust public digital infrastructure is facilitating innovation, productivity improvements and access to services. 

However, the India economy is facing new headwinds, including the adverse effect of climate change. These include high fiscal deficit that requires consolidation anchored on stronger revenue mobilization and spending efficiency; monetary policy tightening to rein in inflation and financial sector vulnerabilities; and financing and technology transfer to move to a carbon-neutral economy. This blog post includes key highlights from the report.

Recent developments

The economy benefited from broad-based recovery from the deep pandemic-related downturn. Real GDP grew by 8.7% in FY2022. All sectors recovered to pre-pandemic levels by end-FY2021/22 except for contact-intensive services, which remained 11% below FY2019/20 levels.

Due to growing domestic demand, commodity and food price shocks, and supply chain disruptions, inflation has been at or above the RBI’s inflation band of 4±2% since January 2022. The report notes that long-term inflation expectations remain relatively well anchored, but the risk of second-round effects from fuel and commodity price shocks remains high.  

Credit growth increased following relatively subdued growth over the past two years. Non-food bank credit growth was driven by stronger credit growth by private banks, mostly to MSMEs in the industry sector. However, credit gap (credit to GDP gap) remains negative, i.e. credit-to-GDP ratio remains below its long-term trend.

The external position in FY2022 was considered broadly in line with that implied by medium-term fundamentals and desirable policies (level of per capita income, favorable growth prospects, demographic trends, and development needs). Current account surpluses and large capital inflows boosted international reserves during the pandemic. The IMF assessed current account gap at 1% of GDP after accounting for transitory impacts of the COVID-19 shock. Current account deficit in FY2022 was 1.2% of GDP, reflecting recovering domestic demand and rising commodity prices. The widening current account deficit and portfolio investment outflows have depleted foreign exchange reserves in FY2023.  External shocks such as global financial tightening and the Russian invasion of Ukraine, and recovering domestic demand have put pressure on the exchange rate. Reserves are enough to cover around 7 months of prospective imports. 

General government fiscal deficit is estimated to decrease to 9.9% of GDP in FY2023 from 10% of GDP in the previous fiscal. Central government fiscal deficit declined to 6.7% of GDP in FY2022 (in its definition of central government deficit, the IMF also includes NSSF loans to central government PSUs and fully serviced bonds). The phasing out of some pandemic-related expenditures contributed to 1% of GDP reduction in spending. Buoyant GST and income tax revenues, thanks to improvements in tax administration and additional taxes on domestic crude oil production and fuel exports, helped boost revenue. The state government’s deficit is estimated to decline close to the medium-term target of 3% of state-level GDP, but variations in fiscal performance persist.  

The pandemic-related disruptions reduced access to education and trainings, adversely impacting human capital accumulation. Most affected were vulnerable groups, including females, youth, less skilled and educated, and daily wage and migrant workers. 

Economic outlook

Growth is projected to moderate amid higher oil prices, weaker external demand, and tighter financial conditions. The IMF projected GDP growth at 6.8% in FY2023 and 6.1% in FY2024. Growth is projected at around 6% over the medium-term. 

General government fiscal deficit is projected to moderate but will remain high: 9.9% of GDP in FY2023, 9% of GDP in FY2024 and then around 7-8% of GDP over the medium-term.

Inflation is projected to moderate to 6.9% in FY2023 as core inflation remains sticky and near-term uncertainties in food prices and input costs affect prices. Inflation is projected to return to the tolerable band over the medium-term. 

Current account deficit is projected to increase to 3.5% of GDP in FY2023 owing to higher commodity prices and import demand, and will decline to about 2.5% of GDP over the medium-term. 

Foreign exchange reserves are projected to cover about 6.5 months of imports over the medium-term. Net FDI inflows are estimated to be about 1.4% of GDP.

Risks to outlook: Uncertainty about the economic outlook is considered high and risk tilted to the downside. A materialization of these risks would worsen the economic outlook (lower growth and trade). 

External risks include a sharp global growth slowdown (affects India through trade and financial channels), and intensification of spillovers from the Russian invasion of Ukraine combined with supply and demand shocks in the global food and energy markets. These can worsen inflation and de-anchor inflation expectations. Over the medium-term, broadening of conflicts and reduced international cooperation can disrupt trade, increase volatility of commodity price, and fragment technological and payments systems. 

Domestic risks include rising inflation impacting vulnerable groups, emergence of more contagious COVID-19 variants, tighter financial conditions (weaken asset quality and result in financial sector stress), high financing costs due to weakening of fiscal position, climate change. 

However, upside risks include a resolution of the war in Ukraine and de-escalation of geopolitical tensions (will boost international cooperation, moderate commodity price volatility, and promote trade and growth). Also, successful implementation of structural reforms and greater than expected dividends from ongoing digital advances could increase medium-term growth potential. 

Fiscal policy: India’s fiscal space is at risk and debt sustainability risks have increased. The government will need to improve targeting to lower public spending. For instance, the reduction in fuel excise taxes and additional fertilizer subsidies are not well targeted. Revenue have been improving due to buoyant GST and income tax revenues. High debt levels (84% of GDP in FY2022) and substantial gross financing needs (15% of GDP) due to higher effective interest rates together with monetary policy tightening have increased debt sustainability risks. These risks are somewhat mitigated as the bulk of public debt are fixed-rate instruments denominated in domestic currency and predominantly held by residents per regulatory requirements. DSA shows that debt dynamics remain favorable in the medium-term and support a sustainable debt path. 

The government has targeted 4.5% of GDP central government deficit, implying a general government deficit of 7.5% of GDP (down from 9.9% of GDP in FY2023). The IMF recommends a clearly communicated medium-term fiscal consolidation plan to enhance policy space and facilitate private sector-led growth. It will also reduce uncertainty, lower risk premia, and help to maintain price stability. 

Fiscal consolidation should be facilitated by stronger revenue mobilization and improving expenditure efficiency. General government primary consolidation of around 1% of GDP and debt of around 80% of GDP by FY2028 could be targeted. 

Expenditure efficiency is possible through better targeting of subsidies, greater utilization of the existing social support infrastructure (DBT) to reduce leakages, rationalization of central schemes, reforming electricity tariffs and improving the financial viability of electricity distribution companies. 

Revenue measures can include reversing the fuel excise tax cuts, further broadening the corporate and personal income tax bases, simplifying the goods and services tax (GST) rate structure, rationalizing the items subject to preferential GST treatment, and continued improvements in tax administration, in line with international good practice. These measures would help narrow India’s tax gap, estimated at around 5% of GDP. Asset monetization and privatization agenda could generate additional receipts. 

Fiscal transparency will improve PFM. For instance, recognizing previously off-budget expenditure at the center and state level has improved transparency. Digital solutions have helped streamline PFM processes, advancing transparency and governance, including through e-procurement, faceless income tax assessments and the recent rollout of e-bills. Integrated Government Financial Management System along with a dedicated platform for central, state, and local governments to share fiscal information will support timely production of consolidated fiscal reports and identification of fiscal risks at the subnational level.  


Wednesday, May 4, 2022

CBS projects Nepal's GDP to grow by 5.8% in FY2022

On 29 April 2022, Central Bureau of Statistics (CBS) estimated that Nepal’s economy will likely grow by 5.8% in FY2022, up from 4.2% growth in FY2021 (this is revised estimate). This projection is a bit more optimistic than what most have expected but is still lower than the government’s 6.5% growth target. The gradual resumption of economic activities, including tourism and hydroelectricity generation, with no disruption caused by the pandemic and the expectation of local elections related spending have driven the optimistic projection. FYI, fiscal year (FY) starts from mid-July of t-1 year and ends on mid-July of t year (for instance, FY2022 refers to the period between mid-July 2021 and mid-July 2022).

FY2021 performance (revised estimate)

GDP in FY2021 grew by 4.2%, up from a contraction of 2.4% in FY2020, thanks to a combination of base effect and resumption of economic activities as the pandemic related restrictions eased. Base effect refers to the tendency of achieving an arithmetically high rate of growth when starting from a very low base.

Agricultural output is estimated to have grown by 2.8% in FY2021 owning to favorable monsoon and a surge in agricultural workers (lockdowns forced reverse migration and contributed to more migrant workers’ engagement in agricultural work) that had a positive effect on paddy output. Industrial output grew by 4.2% from a contraction of 4% in FY2020 as mining and quarrying, manufacturing, and construction activities picked up pace after contraction in FY2020. Services output grew by 4.2% from a contraction of 4.5% in FY2020 as wholesale and retail trade, travel and tourism, financial and insurance and healthcare activities gradually recovered from severe slump in the previous year.  

FY2022 performance (provisional estimate)

The CBS projects GDP to grow by 5.8% in FY2022, up from 4.2% revised estimate for FY2021, thanks to a surge in industrial output driven by hydroelectricity generation and services output driven by travel and tourism activities. Overall, while public investment contracted, private investment and consumption increased. 

Agricultural sector will likely contribute 0.7 percentage points, industrial sector 1.6 percentage points, and services sector 3.2 percentage points to the overall projected GVA growth (basic prices) of 5.5%. GVA at basic prices + taxes less subsides = GDP at market prices.

The sectors with highest growth include electricity, gas and related utility (36.7%), followed by accommodation and food service activities (11.4%), construction (9.5%), wholesale and retail trade (9.1%), mining and quarrying (8.2%), and human health and social work activities (6.9%) among others. 

The estimates are based on data and information up to the first nine months of FY2022 (mid-July 2021 to mid-April 2022) and assumption of normal economic activity during the rest of the fiscal year (mid-April 2022 to mid-July 2022). 

Agricultural output is projected to grow at 2.3%, up from 2.8% in FY2021, largely due to unfavorable monsoon, which affected paddy output. Paddy harvest was affected by unseasonal torrential rain in October that also damaged physical infrastructure and killed over 100 people. The Ministry of Agriculture and Livestock Development said that an estimated 424,113 tonnes of paddy on 111,609 hectares had been destroyed.

Industrial output is projected to increase by 10.2%, up from 4.5% in the previous year, on the back of a substantial increase in additional hydroelectricity generation. Mining and quarrying activities grew by 8.2%, up from 7.5% in FY2021, as residential housing and real estate and development work including hydropower, picked up pace. Mining and quarrying of stones, sand, soil and concrete also get affected by construction sector. Construction activities grew by 9.5%, up from 5.2% in FY2021, as supplies of construction materials normalized (both import and domestic supply), and households, commercial and infrastructure projects picked up pace. It was aided by highly accommodative monetary policy as credit growth shot up relative to deposit growth. A part of refinancing and business continuity loans, which were rolled out as a part of relief measures to help struggling businesses, also made its way to housing and real estate sectors.

Manufacturing grew by 6.1%, up from 4.1% in FY2021, as industrial capacity utilization improved from resumption of economic activities. It has been suffering from low private sector investment, and loss of both domestic and external markets due to eroding cost and quality competitiveness. A stable supply of electricity and improved industrial relations were not sufficient to markedly boost manufacturing output as expected. Meanwhile, the addition of 456MW of electricity from Upper Tamakoshi hydroelectricity project sharply increased electricity output, propelling its growth to 36.7% from just 2.6% in FY2021. However, this has not been sufficient to bridge the electricity demand-supply gap during the dry season. The NEA recently was compelled to introduce loadshedding for industries due to large demand-supply gap and lower imports from India. This could weigh in on the sector’s eventual gross value added output. 

Services output is projected to grow by 5.9%, up from 4.2% in FY2021, thanks to pick up in travel and tourism, and wholesale and retail trade activities. The latter is expected to grow by 9.1%, up from 5.7% in FY2021 as supplies disruptions eased and consumer demand picked up pace, which was also aided by loose monetary and fiscal policies. Surge in import of agricultural and industrial goods in the first two quarters aided. Due to the deterioration of external sector stability and a decline in forex reserves, the government and the central bank started tightening import financing and, in some cases, outright ban on imports. This will affect the sector’s growth in the last quarter of FY2022. Transportation and storage activities are expected to grow by 4.5%, almost at the same rate as in the previous year, despite loosening of international and domestic travel restriction. However, travel is still expensive, which is exacerbated by the increase in fuel prices triggered by Russia’s invasion of Ukraine. Accommodation and food service activities are expected keep growing at a robust pace— 11.4%, up from 10.7% in FY2021—, thanks to a strong pick up in domestic travel and tourism.

Information and communication are expected to grow by 3.6%, up from 1.8% in FY2021. Financial intermediation is projected to grow by 6.1%, higher than 4.0% in FY2021, reflecting improved income of NRB, BFIs, insurance board and companies, securities board, social security fund, EPF and CIF. Real estate activities are expected to increase by 3.8%, up from 2.4% in FY2021, as sale, purchase, lease and other activities related to real estate picked up pace. The proposed local elections related spending on security and public administration is expected to increase public administration and defense activities by 4.4% from 2.3% in FY2021. Healthcare related demand continues to remain strong, keeping its growth rate above 5% since FY2017. 

Agriculture, industry and services sectors accounted for 29.4%, 16.3% and 54.4% of GDP in FY2022.

On the expenditure side, consumption is expected to increase by 5.4%, up from 3.7% in FY2021. While public grows fixed investment contracted by 6%, private fixed investment grew by 8.8%. They grew at 22.2% and 5.6%, respectively in FY2021. Net exports are expected to grow at 12.1%, thanks to exports growth being much higher than imports growth. In fact, imports are expected to grow at a lower rate in FY2022 than in FY2021 as the government and the central bank tightened import financing and at times imposed outright import ban. 

Here are quick takeaways from the latest GDP projection.

First, it may be a bit optimistic projection even after accounting for local elections related spending and normal economic activity in the last quarter of FY2022. The remains three months will be anything but normal in terms of economic activities. Import restrictions, deceleration of official remittance inflows, depreciation of Nepali rupee, rising energy and commodity prices, restrain in government recurrent spending to some extent, and the scheduled electricity blackouts for industries, among others, will depress output and aggregate demand. When revised or actual figures are released, it might be adjusted to around 4.5-5.0%.

Second, the outlook for FY2023 is not rosy. 

  • First, despite the projection of above average monsoon (June to September 2022), the uncertainty over supply of other inputs (chemical fertilizers, access to seeds, access to finance, etc) dims agricultural sector’s growth prospects. Specifically, the shortage of chemical fertilizers will be painful because a good monsoon may increase the area of paddy plantation, but it will not necessarily increase output per hectare of land. Chemical fertilizers are key ingredients to boosting total output and output per hectare of land (productivity). 
  • Second, the slowdown in residential and commercial real estate and housing will affect mining and quarrying, and construction activities. The surge in real estate and housing prices, fueled by easy financing even during the pandemic, has started to taper off as banks and financial institutions tighten lending. 
  • Third, with no drastic addition of hydroelectricity to the national grid and the scheduled electricity blackouts for industries, utility and manufacturing activities may not pick up pace. In fact, industrial capacity utilization may decrease because of both high fuel prices and shortage of electricity. This will be exacerbated by the shortage of imported industrial inputs (industrial raw materials and intermediate goods) either due to outright ban on import of certain goods or tight foreign currency financing to slowdown imports. Factories are enduring up to 14 hours of blackouts due to low generation during dry season and expensive import price of electricity through the power exchange from India. Between 2007 and 2017, the country is estimated to have lost over 6% of GDP due to loadshedding. 
  • Fourth, high energy and fuel prices will also affect services sector activities because a rise in cost of production and inflation will dampen consumer demand. For instance, wholesale and retail trade, and transportation and storage will get affected by both import restrictions and high energy and commodity prices, especially through lower consumer demand as real purchasing power weakens. These two sectors account for about 21% of GDP. Similarly, international and domestic travel, and accommodation and food services will remain expensive, restraining these sectors from sustained recovery.
Against the backdrop of dampening consumer demand due to high cost, deceleration of remittances and tighter monetary policy, slight pick up in travel and tourism and federal and provincial elections related spending may not be enough to sustain GDP growth above 5%. A sustained V-shaped recovery looks less likely.

Third, external sector stress is building up. Since import of petroleum fuel constitutes about 15% of total imports, the import bill is rising sharply. Import demand for petroleum products is relatively inelastic given the lack of immediate substitutes. The import bill of petroleum products in the first eight months of this fiscal year 2021/22 is already higher than the total import of petroleum products for the whole of 2019/20. Note that rise in petroleum fuel prices passes through to other goods as well because it is used in production process and transportation of the goods. Hence, import bill of other goods such as vehicles, machinery and agricultural items is also increasing. Import bill of wheat, rice, crude soya bean oil and edible oil has also increased. Despite gradual recovery in exports, the large import bill has increased import bill by 34.5% in the first eight months of this fiscal. This combined with the deceleration of remittance inflows amidst modest services recovery led by tourism sector widened current account deficit by around 200% in the first eight months of this fiscal. Consequently, balance of payments remains in negative territory with a depletion of foreign exchange reserves which are sufficient to cover 6.7 months of import of goods and services. It was 11.3 months in mid-March 2021. The rapid rise in energy and food prices poses a significant risk to external sector stability. Restricting non-essential imports is a band-aid solution to the structural issue.

Fourth, the recent deterioration of macroeconomic indicators precedes the highly accommodative fiscal and monetary policies after the pandemic started. The vulnerabilities were building up, but the accommodative policies simply masked them. As exogenous forces triggered external sector stress amplify and pandemic related support measures are gradually withdrawn, the vulnerabilities not only unmasking but also exacerbating (stagnating revenue but rising expenditure, low capital budge absorption capacity, asset liability mismatch, evergreening and non-performing loans, low exports but rising imports, sectoral bubbles, etc). For instance, fiscal profligacy led to higher deficit especially after federal, provincial, and local elections in FY2017. Total federal expenditure increased by an average 19.3% between FY2017 and FY2022 (includes budget estimates), but total federal receipts increased by only 14.2%. Consequently, average fiscal deficit was above 5% of GDP. Fiscal balance was either under 3% of deficit or outright surplus (due to low capital spending) before FY2017. This large and growing fiscal deficit increased public demand (consumption and investment) and boosted imports. Meantime, public debt also started rising rapidly. It was just 22.7% of GDP in FY2017 but rose to 40.6% of GDP by FY2021. With this also increased debt servicing costs. 

Similarly, the loose monetary policy and a weak oversight encouraged higher credit growth relative to deposit growth. It was fueled by remittance inflows as well. For instance, the average annual growth rate of deposit over FY2017-FY2021 was 18.3% compared to credit (loans and advances) growth of 21.2%. The weak banking sector oversight fueled real estate, housing, and stock markets bubbles, and encouraged imports. The increase in imports, which increased revenue that incentivized the government to ignore early warning signs of vulnerabilities build up (45% of revenue is import based), started draining foreign exchange reserves after the pandemic at a pace that is perceived to be unsustainable unless corrective actions are taken. During the first eight months of FY2022, foreign exchange reserves were sufficient to cover 6.7 months of import of goods and services. It was 11.3 month in mid-March 2021. Given the currency peg with the Indian rupee, vulnerability to natural disasters and the need for an additional buffer for remittances and tourism-related vulnerabilities, the optimal level of reserves is estimated to be 5.5 months of prospective import of goods and services. The country earns foreign exchange reserves mainly through exports, travel and tourism, investment income, remittances, grants and loans, and foreign direct investment— all of which are below the pre-pandemic level. So, the raft of measures to discourage imports recently in response to the fast-depleting foreign exchange reserves is just a band-aid solution to structural issues. The solution should start with tightening of monetary policy and measures to rein in government spending.

Fifth, the rising inflation— thanks primarily due to high prices of petroleum fuel, LNG, and imported goods— will have a disproportionate effect on the most vulnerable people. The lowest income and poorest households are hit the hardest by increase in fuel and food prices because it constitutes about 65% of their consumption expenditure. For the richest households in the consumption quintile, it is just 34.6%

Sixth, the size of Nepali economy is estimated at US$40.2 billion. Per capita GDP and per capita GNI are estimated at $1364 and $1380, respectively. GNDI (GNI + net current transfers incl remittances) is estimated to reach 123.3% of GDP. Gross domestic savings (GDP – consumption) is around 9.3% of GDP, reflecting high level of consumption. The country’s population in FY2022 is estimated to be 29.5 million.

Monday, April 5, 2021

Energy sector prospect in Nepal

In an excellent article about energy sector in Nepal in New Business Age, Rupak D Sharma argues that given the large generation capacity in pipeline and the prospect of supply outstripping demand, there is no choice but to export electricity (to India and perhaps Bangladesh) in the short-term and then work to increase per capita electricity consumption over the medium-term. Above all, escalating cost of production needs to be controlled.


[...]A total of 15 new projects built by the private sector added 135.39 MW of electricity to the national grid in the last fiscal year. Two projects of NEA, 60MW Upper Trisuli 3A Hydroelectric Project and 14MW Kulekhani III Hydroelectric Project, also came into operation that year. The energy sector is expected to see an addition of over 800 MW of electricity in this fiscal year alone if the 456MW Upper Tamakoshi Hydroelectric Project comes online. What’s more, 131 additional private sector-led projects with a combined capacity of 3,157.19 MW are under construction. And another 112 private sector-led projects with a combined capacity of 2,124.77 MW are in different stages of development, according to NEA’s latest annual report.

[...]Nepal’s energy generation cost has significantly gone up over the years due to a hike in project development cost. A few years ago, the cost of building a hydroelectric project used to hover around Rs 150 million per MW. The cost has now surged by 33 percent to Rs 200 million per MW. This has made electricity expensive, raising the spectre of restricting domestic consumption and making energy generated in Nepal uncompetitive in the foreign market.

[...]In a typical hydropower project, construction materials, such as cement, steel and aggregates, command a weight of about 40 percent in the total development cost, according to Pradhanang. Labour costs make a contribution of around 20 percent to the total cost, while soft costs, such as engineering design and management, command a weight of 25 percent. The share of the cost of electromechanical items in total project development cost stands at about 15 percent.

Over the years, labour costs have surged as most of the youths have left the country for labour destinations in the Gulf, Malaysia and other countries across the globe, creating a shortage of workers. At the same time, prices of construction materials, such as cement, steel and aggregates, have steadily gone up. Each kg of TMT 500D steel now costs Rs 95, as against Rs 75 two years ago. In India, the same product can be bought for INR 34-47 (Rs 54.4-75.2) per kg in the retail market. Cement is also a lot cheaper in India, where a 50-kg bag of OPC can be fetched for INR 300-350 (Rs 480 to Rs 560). The same quality and quantity of cement costs Rs 700 in Nepal, up from Rs 650 in early 2019.

[...]NEA will be in a position to export 25 to 30 MW of electricity round the clock in the next three months, according to NEA Managing Director Hitendra Dev Shakya. By the upcoming rainy season, that capacity will rise to 450 MW. The portion of surplus energy will continue to rise in the coming years, as NEA has already signed agreements to purchase 5,978.13 MW of electricity from 341 private developers, which is four times the current installed capacity. Nepal will not be able to consume all this electricity in the short run, as its electricity demand currently stands at around 1,500 MW; and it will take several more years to increase domestic consumption. This indicates lots of energy will go to waste if it is not exported.

[...]the Indian government in 2021 issued a procedure for cross-border imports and exports of electricity. The procedure, which has been welcomed by Nepal’s private sector power producers, has finally paved the way for government entities and the domestic private sector to export power to India. [...]Yet one question that many ask is whether India needs Nepal’s electricity as its supply has exceeded demand for over two decades. India currently has an installed capacity of approximately 375,325 MW whereas its peak electricity demand stands at 184,033 MW. Nonetheless, India may want to buy Nepal’s electricity as it generates over 60 percent of its energy through thermal sources such as coal, which are not clean. Since India is looking to migrate to clean sources of energy, Nepal may find a small market to sell its electricity. Lately, there are also talks of selling Nepal’s electricity in the Indian spot power market, where prices are relatively higher.

[...]NEA has reached a conclusion that there is no alternative to exporting power in the short run as the domestic market is not in a position to rapidly enhance its electricity consumption. But in the long run Nepal will have to enhance its energy consumption capacity, as electricity is a raw material and if value is added to it to generate other products the country will be able to generate higher returns.

[...]Even if NEA defaults on 1,000 MW of payments, Rs 140 billion in bank credit will be at the risk of going sour, considering per MW construction cost of Rs 200 million and 70 percent debt facility that banks provide. This amount is over 2.5 times the net profit of all commercial banks in the last fiscal year. Such a huge scale of credit default will not only hit the banking sector, but the entire stock market and the economy.


Sunday, January 24, 2021

Vietnam as a rising star in global supply chains

Cheap labor costs, big investment incentives, political and policy stability, and strong trade relations appeal Vietnam as an alternative investment destination to China, according to a special report published by The Economist Intelligence Unit. The country is now rated more highly than competitors such as China, Indonesia, India, Bangladesh and Pakistan. [Interestingly, Sri Lanka is rated the most favorable in South Asia in terms of business environment.]

The report focuses on labor, investment incentives, and trade relations, which are central to Vietnam’s competitiveness as a manufacturing hub.

First, the report argues that the ample supply of low-skilled labor will remain a core strength of Vietnam. Working age population is estimated at 68 million, which is about 70% of total population. It appears to be enjoying a “demographic dividend”, which refers to a share of working-age population being larger than those under 15 and over 64 years of age. Agricultural sector accounts for over one-third of the employed workforce, and workers from rural areas have been a key source of labor in manufacturing sector. There is still a stock of surplus labor in the agricultural sector, which means wages growth among low-skilled and unskilled workers in manufacturing sector will remain restrained. However, the availability of skilled labor force will still be an issue.

Second, the report states that Vietnam is offering generous concessions for high-tech manufacturers thinking to relocate labor-intensive processes. Incentives for lower-value added industries will be continue to be rolled back. Vietnam offers various incentives for FDI in industrial zones (industrial parks and export-processing zones), special economic zones, and technology parks. Most are export-oriented industries. It offers corporate and personal income tax exemption and rate reduction. High-tech sectors such as automotive, machinery, and production of advanced capital goods are offered below-market land rents, which is a major incentive amidst rising rent costs. Eligibility criteria are made flexible, especially for large firms. EPZs are not that popular these days because of reduction of import tariffs, which have made duty-free intermediate imports under EPZs largely redundant. The report notes that going forward the eligibility criteria for investment incentives will focus on higher value-added industries. 

Industrial clusters in Vietnam are concentrated in four geographical areas that were designated as priority regions for industrial development: Northern, Central, Southern and Mekong Delta Key Economic Zones. Footwear, textile and garment industries are well developed with advanced labor specialization and scaled-up manufacturing operations. Electronics exports have limited domestic value added, which the government is trying to change through vertical integration in the production of smartphones (Samsung is opening a R&D facility and a phone screen manufacturing plant).

Third, the report notes that Vietnam participates in more trade agreements and has better trading relations with major trading partners than its regional neighbors. This helps in promoting competitive export. It is a member of ASEAN Economic Community, Regional Comprehensive Partnership Framework, Comprehensive and Progressive Agreement for Trans-Pacific Partnership, and the EU-Vietnam Free Trade Agreement. For instance, CPTTP opens up more access to Canada and Mexico (with whom it did not have agreements before) for Vietnamese sports footwear, telephone sets, electrical machinery, and clothing and apparel.

Wednesday, September 2, 2020

Remittances and external sector stability in Nepal

It was published in The Kathmandu Post, 02 September 2020. Related Twitter thread with charts here. 


The cash cow is drying up

Don’t be fooled by the better-than-expected results from the external sector, the effects are only temporary.

The latest provisional data for the fiscal year 2019-20 released by the Nepal Rastra Bank provide interesting insights on the impact of Covid-19 and the subsequent lockdowns on the economy. Almost all areas, except for the external sector, have been hit hard since the first lockdown began in late March. Specifically, unlike projections of a sharp drop, the data shows just a small deceleration in remittances.

This has led some to argue that Nepal’s external sector is sound as well as resilient and that vulnerabilities are on the downside. However, the reality is that it only appears sound owing to a larger import contraction than export contraction, and slower than expected deceleration of remittances. Remittances are an important household coping strategy when faced with an adverse income or consumption shock. Migrant workers tend to use precautionary savings to remit more after such shocks. This should not be construed as a sign of resilience.

Still unstable

A sudden supplies disruption was expected to hit imports and remittances, resulting in an improvement in the current account balance, which is a record of Nepal’s transactions with the rest of the world. Exports pretty much stalled after the pandemic spread globally. Imports, except for medical equipment and supplies, were also severely curtailed due to disruptions and logistical hurdles. Further, oil imports, which normally account for 15 percent of the total import bill, decreased on account of a drop in internal demand, particularly for transportation and development projects.

Declining global oil prices also contributed to a lower oil import bill. Consequently, imports decreased much faster than exports. For instance, in US dollar terms, merchandise exports and imports contracted by 7.9 percent and 18.9 percent, respectively. In a reversal of the previous trend, merchandise trade deficit actually dropped to 28.2 percent of the gross domestic product in 2019-20 from 37.1 percent of GDP in 2018/19.

Similarly, the trade imbalance in services also improved as services import (which includes outbound travel and foreign educational expenses) decreased much more than services export (which includes inbound travel and tourism). A sharp contraction of imports but a small contraction of remittances (by just 3.4 percent) improved the current account balance. This is what the analysts meant when they argued that the external sector remained stable despite the adverse external environment.

Meanwhile, the balance of payments reached a record $2.4 billion as a large contraction of imports but a lower than expected deceleration of remittances and an increase in foreign direct investment and foreign emergency loans all played crucial roles. Similarly, gross foreign exchange reserves have also hit record levels. The Nepali rupee depreciated by 9.2 percent against the US dollar at the end of 2019-20.

The improvement in the current account balance, a large balance of payments surplus and record foreign exchange reserves might have given a misplaced assurance that all is sound and stable. But regardless of the pandemic being contained or the country choosing to simply live with the virus, as the economy opens up after the lockdowns and supply chains are restored, the situation might quickly change.

Most prominently, the import of commodities (oil, food and raw materials) as well as intermediate capital goods will increase. Meanwhile, given the lack of price competitiveness, an unfavourable policy environment, distortionary incentives and generally subdued external demand, exports will likely not recover soon. Travel and tourism activities may not also recover quickly. These will deteriorate the tenuous external sector stability and put a strain on foreign exchange reserves.

A short respite

The problem will be compounded by the expected deceleration of remittance inflows. Apart from its positive effect on reducing poverty and boosting consumer demand, government revenue and financial sector liquidity, large remittance inflows have been a saving grace for external sector stability in the face of a large and growing trade deficit. The number of Nepali migrant workers has been continuously declining since 2014-15. The persistent deceleration of remittances will be coupled with a smaller expatriate workforce, with fewer outbound migrant workers and a reduction in the work hours of those already working abroad.

There are three main reasons why remittances did not decelerate as expected in 2019-20. First, remittances tend to increase immediately after a shock in receiving countries. For instance, remittances increased by 12.2 percent in 2014-15 as migrant workers, drawing from their precautionary savings, remitted more income to their earthquake-affected families. However, the following fiscal it only grew by 0.8 percent. Second, the depreciation of the Nepali rupee against the US dollar also provides an incentive for migrant workers to remit more money. The rupee depreciated by 9.2 percent in mid-July 2020, much higher than 0.02 percent depreciation in mid-July 2019. Third, the use of formal banking channels to remit income has increased along with the rise in the number of money transfer agencies and the crackdown on informal inflows.

The Nepali economy entered the Covid-19 era with pre-existing weaknesses: a weak foundation for meaningful structural transformation, volatile GDP growth and inflation, mounting fiscal stress due to a large fiscal deficit and increasing public debt, persistent asset-liability mismatches and high credit growth by financial institutions, and decelerating remittances. It was exacerbated by weak governance and contract management in public projects, political infighting within the ruling party, over-politicisation of the Millennium Challenge Corporation’s compact programme and geopolitical discord. The potential deceleration of remittances will exacerbate these trends, and heighten external sector stress.

Sunday, August 23, 2020

The impact of COVID-19 on Africa

Paul Collier explains how four shocks (drop in commodity prices, remittances, tourism, and international capital) due to the overarching COVID-19 shock are threatening Africa's progress.


Two in three jobs in sub-Saharan Africa are in the informal sector. There are no economies of scale or specialisation. Small is not beautiful, it is unproductive. Africa needs more companies capable of organising a workforce into specialised, collaborative teams, disciplined by competition. Yet even the firms that Africa has are bleeding from the economic impact of coronavirus.

This shock is not predominantly a result of Africa’s health crisis. The causes are the sharp downturns in advanced economies. Commodity prices have dropped and Africa is a major net exporter.

Senegal and Ethiopia are major recipients of remittances from citizens working abroad. Normally, these rise during a domestic crisis, but in this global emergency Africa’s diaspora are losing their jobs. This also hits the most desperate places such as Yemen.

Finally, the retreat of international capital to safety is hitting hardest the countries that were most promising for investors. Ghana was attracting US pension fund money and major companies such as Volkswagen and Bosch. All four shocks are eroding Africa’s scarce organisational capital and are likely to persist for the medium term.


Impact of COVID-19 on the external sector

The IMF’s latest external sector report highlights the state current account balance amidst the global trade and supplies disruptions caused by the COVID-19 pandemic. The pandemic has sharply curtailed global trade, lowered commodity prices, and tightened external financing conditions. 

According to the report, the world had a current account surplus of about 2.9% of world GDP in 2019. About 40% of current account surpluses and deficits were excessive in 2019. Euro area had larger-than-warranted current account balances, but the US, the UK and Canada had lower-than-warranted current account balances. China’s external position remained unchanged and they were broadly in line with fundamentals and desirable policies. Currency movements were generally modest, but with preexisting vulnerabilities/fundamentals in EMDEs (large current account deficits, a high share of foreign currency debt, and limited international reserves or reserves adequacy). 


The IMF forecasts current account surplus narrowing by 0.3% of world GDP in 2020, thanks to large fiscal expansion but offsetting increases in private savings and lower investment (precautionary move by household and business sectors). Economies dependent on severely affected sectors such as oil and tourism, and remittances have been hit hard.  There was a sudden capital flow reversal and currency depreciations in EMDEs as financial market sentiment deteriorated during the initial days of the crisis. Unsurprisingly, global reserve currencies appreciated as investors looked for safe haven amidst the financial stress. There is some unwinding now though, reflecting exceptional monetary and fiscal policy support. 

Current account balances in 2020 will be affected by 

  • Contraction in economic activity (lower output/export and import demand)
  • Tightening in global financial conditions
  • Lower commodity prices (oil, metals, food, raw materials)
  • Contraction in tourism
  • Decline in remittances 

The number of export restrictions in 2020 is higher than during the global financial crisis, but the number of import restrictions is lower. Sectors such as pharmaceutical and medical supplies, made-up textile articles, wearing apparel, rubber products, and ethyl alcohol and spirituous beverages faced the most export restrictions.  

Some EMDEs with preexisting vulnerabilities (large current account deficits, a high share of foreign currency debt, and limited international reserves) might face high risk of an external crisis (with capital flow reversals and currency pressures) if risk sentiment deteriorates. 

A second wave of the pandemic could lead to tightening of global financial conditions, narrow the scope of EMDEs to run current account deficit, further reduce current account balances of commodity exporters, and deepen the decline in global trade. Up to now, swift response of central banks (policy rate cuts, liquidity support, asset purchase programs, and swap lines offered by the US Federal Reserve) and expansionary fiscal policy have contributed to an easing in global financial conditions. EMDEs experienced sudden capital flow reversals in late February and march but then stabilized in most cases with even modest inflows in selected economies. 

Near-term priority

The near-term priority should be to provide relief and promote economic recovery. 

  • Flexible exchange rates should be allowed to adjust as needed to absorb external shocks (especially a fall in commodity prices or tourism). 
  • Official financing to ensure continued healthcare spending is required for those economies experiencing disruptive balance of payments pressures and without access to private external financing. 
  • Tariff and non-tariff barriers to trade, especially on medical equipment and supplies, should be avoided. 
  • Countries with adequate forex reserves could engage in exchange rate intervention to avoid disorderly market conditions and limit financial stress. 
  • Countries with limited reserves and facing reversals of external financing, capital outflows management measures could be useful (but these should be used to substitute the warranted macroeconomic and structural policy actions).

Medium-term priorities

Preexisting economic and policy distortions may persist or worsen over the medium-term.

  • Fiscal consolidation over the medium term would promote debt sustainability, reduce current account gap, and facilitate raising international reserves. Note that excess current account deficits in 2019 partly reflected larger-than-desirable fiscal deficits. 
  • Productivity-enhancing reforms would benefit economies with low export competitiveness. 
  • For countries with large current account surpluses after the COVID-19 pandemic, prioritizing reforms to encourage investment and discourage excessive private savings are warranted. In some instances, economies with large current account surpluses could discourage excessive precautionary savings by expanding the social safety nets. 
  • For economies with some fiscal space, emphasis on greater public sector investment would be helpful to narrow excess surpluses and to stimulate economic activities. 

Outlook for 2021

The outlook for 2021 is highly uncertain. Under a scenario where a second major global outbreak occurs in early 2021 (disruptions to economic activity is assumed to be half the size of the baseline in 2020, financing tightening of about one-half of the increase in sovereign and corporate spreads since the outbreak began in EMDEs, and relatively limited tightening of sovereign premiums for advanced economies),

  • Global trade is projected to decline by an addition 6%, global GDP decline by 5%, and oil prices to be higher by 12% compared to the baseline. 
  • Recovery in global trade will be underpinned by the need to rebuild the capital stock (investment goes up), and higher import intensity of exports. 
  • Emerging market economies will face higher borrowing costs, lower oil prices and subdued domestic demand – it will raise current account balances toward surplus. 
  • Net oil exporters will face lower oil prices, which will reduce their current account balances.
  • Advanced economies will face relatively limited tightening in external financing conditions and greater fiscal policy space will mean lesser import compression than among EMs, leading to lower current account balances. 
  • So, capital will flow from EMs to AEs, highlighting the unequal impact of the crisis and the need for a global policy response. 
  • Under a faster recovery scenario, global trade rises by 4% in 2021 compared to the baseline. 

The report notes that the historical relationship between trade and the components of GDP/aggregate demand (or import-intensity-adjusted measure of aggregate demand, which basically is a weighted average of aggregate demand components in which the weights are the import content of each component computed from national accounts input-output tables) fully explains the expected global decline in trade of goods. A part of the impact of lower economic activity on trade is felt through global value chains. After the global finance crisis circa 2009, residual factors such as rising protectionism explained part of the fall in trade in goods and services as they could not be fully explained by the fall in economic activity alone. Services trade contraction in 2020 is more severe than what could be expected based on the historical relationship between services trade and aggregate demand, suggesting the role of special factors such as travel restrictions. 

The IMF determines excessive current account balances by comparing the actual current account (stripped of cyclical and temporary factors) and the current account balance that is consistent with fundamentals and desirable policies. The resultant gap reflects policy distortions (e.g., higher current account balance than implied by fundamentals and desirable policies correspond to a positive current account gap, whose elimination is desirable over the medium-term). The IMF also considers REER that is normally consistent with the assessed current account gap. A positive REER implies an overvalued exchange rate. Other indicators that are considered are financial account balances, international investment position, reserve adequacy, and other competitiveness measures such as the unit-labor-cost-based REER and staff views on the current account gap using country-specific trade elasticities. 

On economic and financial fundamentals, and desired policies, advanced economies with higher incomes, older population, and lower growth prospects have positive current account norms. EMDEs tend to have negative current account norms because they are expected to import capital to invest and exploit their higher growth potential.

Sunday, May 3, 2020

Covid-19: Impact and response

It was published in The Kathmandu Post, 03 May 2020.


The strict lockdown to contain the spread of SARS-CoV-2 and supplies disruptions are wreaking havoc on the economy. It is going to push many vulnerable households below the absolute poverty line and will likely increase inequality. According to the latest projections, gross domestic product growth will fall sharply to 2.3 percent in the fiscal year 2019-20, much lower than the 7.1 percent last fiscal and the government’s pre-Covid-19 target of 8.5 percent.

A sudden lockdown, coupled with the lack of contingency plans to smoothen consumption, supplies and housing, has inflicted appalling hardships on migrant workers and the poor and vulnerable. Similarly, businesses are facing financial stress or are outright bankrupt. The economy urgently needs a fiscal relief package for the vulnerable population and micro, small and medium enterprises (MSMEs), followed by a recovery package after the spread of Covid-19 is largely contained. However, effective last-mile delivery—that actually reaches the intended beneficiary households and businesses—is a huge challenge due to weak accountability and targeting mechanisms.


During the lockdown, over 90 percent of economic activities have come to a grinding halt. The latest projections show that the agricultural, industrial and services sectors are projected to grow by 2.6 percent, 3.2 percent and 2 percent, respectively. These numbers are drastically lower than the growth these sectors experienced last fiscal year.

The economy was already weak before the lockdown and social distancing measures were implemented. For instance, a delayed monsoon, shortage of fertilisers, use of substandard seeds and an armyworm invasion dented agricultural output before the Covid-19 pandemic. The pandemic exacerbated the situation through agricultural inputs crunch (such as workers and fertilisers), especially to harvest winter crops, connect to agricultural markets, and prepare for summer crops.

Similarly, weak capital spending and the lack of an investment-friendly environment affected industrial output before the pandemic. The Covid-19 outbreak in Nepal happened to exacerbate the situation as it hit in the second half of the fiscal year—the period when a majority of economic activities occur. No wonder, mining and quarrying, manufacturing and construction activities are expected to contract in the current fiscal year. Work from home norms do not apply to these activities and productivity losses will continue to linger for some quarters.

Within the services sector, a deceleration of remittance income and decline in imports were already affecting retail and wholesale trade, which has the second-largest share in the GDP. After the pandemic, this sub-sector is expected to grow by just 2.1 percent, down from 11.1 percent last fiscal. Travel and tourism-related activities such as hotels and restaurants, and transport, storage and communications are expected to contract. Other services activities that are badly hit are financial intermediation, real estate and business activities, and education. Note that casual workers and informal sector firms, mostly MSMEs, are concentrated in the services sector.

Overall, consumption has been subdued, and fixed public and private investments are contracting. The government’s 2.3 percent growth estimate for the fiscal year might itself be a bit optimistic because it assumes that the affected economic activities, except for international tourism-related activities, will start to pick up pace from mid-May. But this is highly unlikely, owing to the uncertainties over Covid-19 contagion, unfavourable external factors (decline in remittances and foreign direct investment), difficulty to quickly reverse the dispersal of workers, and supply disruptions.

This crisis will increase the fiscal deficit because of lower than expected revenue mobilisation and nominal GDP growth, and higher than expected expenditure needs. Inflation may rise, but not to the extent seen during previous crises as depressed consumer demand will somewhat counteract cost-push inflationary pressures arising from a shortage of goods and services. Similarly, a decline in exports as well as imports, and deceleration of remittance inflows might have a net effect of reducing the current account deficit. However, foreign exchange reserves will fall. This is not good, as it jeopardises external sector stability.

Importantly, since a large proportion of the households are clustered just above the absolute poverty line, an income shock due to the Covid-19 will push many of them below the poverty line. It will also potentially widen inequality because the poorest households are disproportionately affected. Note that over 62 percent of the employed workforce is in the informal sector and about 85 percent of them are employed informally—that is, those who do not have paid annual leave or sick leave benefits and whose employers do not contribute to their social security. Social protection problems, as well as unemployment, are going to exacerbate as mass internal layoffs and returning migrant workers increase in the coming weeks. The unemployment rate was already over 11.4 percent and the labour underutilisation rate, which includes unemployed, time-related unemployed and potential labour force, was even higher at 39.3 percent.

Crisis response

Given the enormity of the emerging health, social and economic problems, a well-coordinated and synchronised relief and recovery package is of urgent need. Extraordinary circumstances require exceptional measures, but the government’s economic response has been ordinary at best.

A detailed relief and recovery package is missing. The immediate-term focus should be to stabilise aggregate demand and to lower the burden on workers due to unemployment and income shock. These are best done through the expansion of social protection measures and easing regulatory as well as liquidity constraints faced by MSMEs. After Covid-19 pandemic subsides and is largely contained, a full economic recovery package is required to help struggling businesses and workers. This is also a time to think of import-substituting production and the diversification of sources of economic growth and poverty reduction.

Further, although the fiscal space is already tight, thanks to expansionary redistributive budgets in the previous years, there should be no confusion about financing Covid-19 related measures by tweaking expenditure allocation. Of course, revenue mobilisation will be lower than projected and so will be spending. But, a repurposing of the recurrent budget (especially those allocated to use of goods and services) and capital budget (allocated for vehicle purchase, consultancy, land acquisition and some civil works) is still possible. The government can issue bills and bonds as planned and raise the required money for immediate needs.

It can be used to expand unemployment and other social security-based direct cash transfers, boost healthcare spending, provide relief to farmers, subsidise food and daily essentials, guarantee credit on additional working capital for MSMEs, subsidise employee retention, cover the short-term interest on loans taken by MSMEs, expand insurance coverage, and pay premium perks for frontline workers, among others. Similarly, the government can use funds related to social security, foreign employment welfare, constituency development, and prime minister employment scheme. It could also use funds lying idle at various autonomous authorities. These measures do not necessarily jeopardise fiscal sustainability.

Moreover, the government can request the Asian Development Bank and the World Bank—the largest multilateral lenders to Nepal—to repurpose existing assistance towards the government’s new immediate and medium-term priorities. It can also seek additional concessional loans, given the enormity of the crisis and the fiscal burden in the next few years. Multilateral lenders have rapid disbursement facilities for emergency assistance and policy-based loans for budget support to help the government’s agenda.

Finally, the government could issue a pandemic bond and request the central bank to purchase it under a special one-off mechanism. For instance, the central bank can repurchase government bonds from the market and return the funds to the government’s account when they are due. Or it can perpetually roll it over.

Friday, March 13, 2020

Economic crisis ensuing medical shock and flow of income

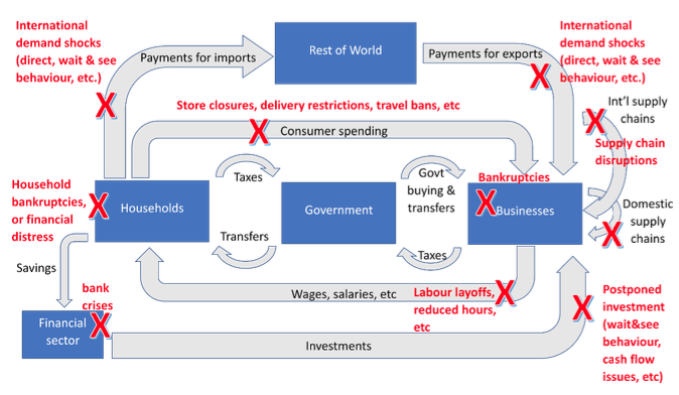
Richard Baldwin has a nice post on VoxEU on the effect of COVID-19 medical shock on economic crisis. He argues that this economic crisis is different because it has hit all the G7 economies and China at the same time and from multiple fronts. Here is his depiction of the famous circular flow of income diagram and how the medical shock is disrupting flow of goods & services and money. 
   
There is a combination of a supply and a demand shock. It is leading to expectations dampening and hysteresis. Bond prices and stock prices are moving in the same direction (not usual) and normally liquid assets are freezing up. Even gold futures have been falling. Risk averse behavior of households and business across investment and saving assets. Gripping uncertainty.