Wednesday, April 10, 2013

ADB forecasts Nepal’s GDP to grow by 3.5% in FY2013

The Asian Development Bank (ADB), in its flagship publication Asian Development Outlook (ADO) 2013 released today, forecasted Nepal’s GDP growth at 3.5% for FY2013 (2012/13) and 4.2% in FY2014. Furthermore, the ADO 2013 estimated regional economic growth in the Asia Pacific region to pick up to 6.6% in 2013 and reach 6.7% in 2014.

This year’s ADO focuses on Asia’s energy challenge. It notes that:

  • Developing Asia's energy needs will expand in tandem with its growing economic influence, but its own endowment is insufficient;
  • Expanding renewable energy sources will not be enough to meet future demand. Consequently, Asia needs to invest in making conventional power cleaner and more efficient; and
  • Asia must aspire to the degree of regional cooperation and integration in energy by 2030 that currently prevails in Europe.

Below are highlights from the Nepal chapter of the ADO 2013:

Economic performance in FY2013

GDP growth


  • Growth to rebound to 4.5% in FY2012
    • Agriculture sector grew by 5.0%, the highest in 4 years
    • Services sector grew by 4.5%
    • Industry sector continued to perform poorly (growth dropped to 3.0% in FY2012 from 4.4% in FY2011) -- Unfavorable business and investment climate (labor disputes, persistent electricity shortages, political uncertainties)
Inflation

  • Inflation eased to 8.3% in FY2012 (food prices declined during most of the year)
  • Stubbornly high inflation caused by:
    • Rising prices of non-food items (reflected by inflation in India)
    • Upward adjustment of administered fuel prices
    • Depreciation of Nepali rupee against third world currencies
    • Rising wages
    • Persistent supply-side constraints (power outages; market distortions by monopolists and monopsonists; infrastructure hiccups; strikes)
Fiscal sector

  • Budget deficit narrowed narrowly to 2.2% of GDP in FY2012
    • Lower capital expenditure
    • Greater revenue mobilization
      • Increase by 22.5%, reaching 13% of GDP
      • Improved efficiency in tax administration and widening of tax base
  • Not a desirable outcome for a country with large development needs and significant absorption capacity as well as multiplier effect from investment in infrastructure
  • Total expenditure was 20.4% of GDP, slightly higher than in FY2011
    • High recurrent expenditure, reaching 15.6% of GDP in FY2012 from 12.4% of GDP in FY2011
      • To cover large subsidies on fuel and ad hoc expenditure programs
  • Capital expenditure low, dropped to 3.3% of GDP in FY2012 from 6.5% of GDP in FY2011
    • Lower project disbursements due to lack of timely budget
    • Sharp drop in capital spending allocation itself
Monetary sector


  • Central bank’s proactive role and corrective policies led to containment of the fallout of real estate and housing prices
  • Robust remittance inflows boosted deposits and increased liquidity
  • Interbank rates dropped to 1.1% in FY2012 from 8.1% in FY2011
External sector

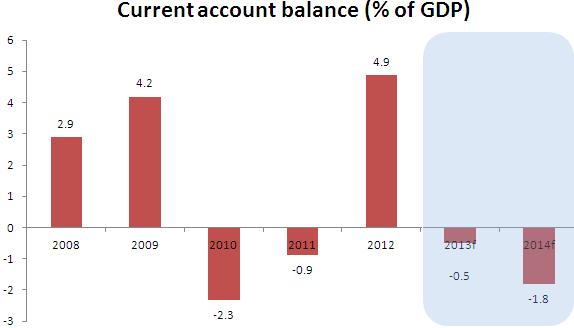
  • Current account recorded a large surplus of 4.9% of GDP in FY2012 from negative 0.9% in FY2011
    • Massive rise in remittance inflows
    • Modest import growth of 4.5% relative to export growth of 5.4%
  • Overall balance of payments surplus reached $1.6 billion
  • Foreign exchange reserves reached $4.2 billion, enough for 7.9 months of import of goods and services.


Prospects for FY2013 and FY2014


GDP growth


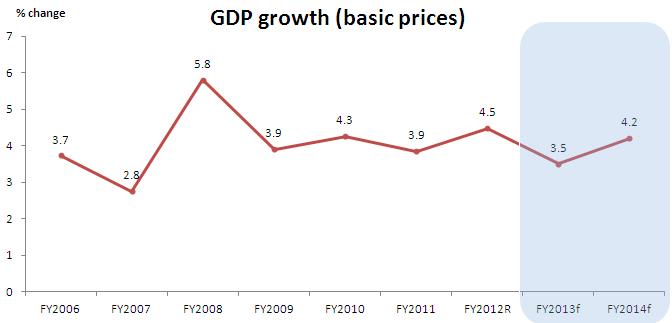
GDP growth in FY2013 expected to decline
  • Unfavorable monsoon
  • Shortage of fertilizers
  • Low business confidence
  • Lack of full budget
  • Subdued growth in India
GDP growth in FY2014 expected to rebound
  • Favorable monsoon
  • Adequate fertilizer supply
  • Timely and full budget
  • Moderate expansion of remittances

Inflation


Inflation in FY2013 expected to increase
  • Lower agriculture harvest
  • Wage pressures
  • Upward adjustment of administered fuel prices
  • Power shortages
  • Supply-side constraints
Inflation in FY2014 expected to moderate
  • Good harvest
  • Underlying pressures of FY2013 to persist
  • Cautious policies

External sector


Trade deficit to markedly widen in FY2013
  • Exports growth to decline
  • Subdued growth in India
  • Sluggish activity in Euro area and the US
  • Rising cost of production
  • Imports growth to sharply increase
  • Driven by remittances (lag effect as well)
Current account balance to be negative
  • Wide trade deficit
  • More moderate remittance growth

Fiscal sector

Lack of a full-fledged budget for FY2013
  • Revenue policy guided by Finance Act 2012
  • Capital budget allocation and actual expenditure low
  • Impressive revenue mobilization
  • Domestic borrowing not allowed
  • Fiscal deficit may marginally widen
Moving forward, a full and timely budget for FY 2014 is essential
  • Timely passage to allow for change in revenue policy, allow for domestic borrowing , and accelerate development activities
  • Quality of public spending, aid effectiveness and governance issues need to be addressed

Sunday, April 7, 2013

CBS projects GDP growth at 3.6% in FY2013 in Nepal

The Central Bureau of Statistics (CBS) released its annual national account estimate on 5 April 2013, projecting GDP at basic prices to grow at 3.56%, down from 4.48% revised estimate for FY2012 (fiscal year ends on 15 July). In FY2012, agriculture growth of around 5% and services growth of 4.5% propelled overall GDP growth (revised estimate) to 4.5%, up from 3.9% in FY2011. Industry sector growth dropped to 2.96% in FY2012 from 4.4% in FY2011. In 2012, the CBS’s GDP growth projection for FY2012 was 4.6%.

GDP_NEPAL FY2011 FY2012R FY2013P
GDP growth rate (basic prices) 3.85 4.48 3.56
Primary Sector 4.48 4.98 1.31
Secondary Sector 4.4 2.96 1.49
Tertiary Sector 3.42 4.51 6.03
Composition of GDP (%)  
Primary Sector 37.37 36.31 35.32
Secondary Sector 14.94 14.30 14.35
Tertiary Sector 47.69 49.39 50.33

In FY2013, the CBS projects services sector to grow by 6.03%, industry sector growth to further drop to 1.49%, and agriculture sector to grow by a mere 1.31%. The sharp drop in agriculture growth is attributed to the unfavorable monsoon and shortage of chemical fertilizers during peak paddy planting season. The industry sector continues to be beset by persistent supply-side as well as structural constraints, including power outages, labor disputes, low productivity, high cost of raw materials and production, inadequate investment climate reforms, lack of innovation and research and development, corruption, and political instability. Given the slowdown in growth of remittances, it appears services sector might grow lower than what CBS’s is projecting. Hence, 3.56% GDP growth projection is very optimistic. Taking into account the latest developments and updates, GDP will likely grow between 3.2% (the IMF says it might be even below 3%) and 3.5%. Anyway, as in previous years, services sector will contribute the largest push to GDP growth rate in FY2013.

At the sub-sectoral level (GDP consists of 15 sub-sectors broadly categorized under three sectors, namely agriculture, industry and services), the highest growing (revised estimate) sub-sectors in FY2012 were health and social work (9.95%); electricity, gas and water (8.41%); fishing (7.55%); community and social activities (6.65%); hotels and restaurants (5.96%); mining and quarrying (5.03%) and education (5.02%). Construction registered the least growth(0.22%).

In terms of contribution to GDP growth rate (sub-sectoral growth rate times its share of GDP at factor cost), agriculture and forestry had the major role, followed by transport, storage and communication; wholesale and retail trade; education; community and social activities; and real estate, renting and business activities.

In FY2013, the CBS projects wholesale and retail trade to register highest growth (9.54%), followed by health and social work (6.95%); hotels and restaurants (6.84%); transport, storage and communication (6.73%); and mining and quarrying (5.45%). The three lowest growing sub-sectors are construction (1.57%); agriculture and forestry (1.21%); and electricity, gas and water (0.2%).

In terms of contribution to GDP growth in FY2013, the largest contributor is projected to be wholesale and retail trade, followed by transport, storage and communication; agriculture and forestry; financial intermediation; and education. The least contribution would come from mining and quarrying; fishing; and electricity, gas and water. Again, the real story here is that the optimistic CBS projections for services sector might not be realistic and hence the related sub-sectoral growth, contribution to GDP growth rate, and overall GDP growth rate.

In terms of productivity and a meaningful structural transformation with higher value added jobs, the most important sector is industry (specifically, manufacturing sub-sector within it). Unfortunately, manufacturing’s share of GDP is continuously shrinking (revised estimate of 6.28% in FY2012 and projected 6.17% in FY2013). Its growth is projected to drop to 1.85% in FY2013 from 3.63% in FY2012. As mentioned earlier, it points to the persistent supply-side as well as structural constraints.

Interestingly, in US dollar terms, projected per capita GDP for FY2013 ($717) is lower than the actual per capita GDP in FY2011 ($718). Nepalese people are getting poorer! Real per capita GDP growth is projected to slowdown to 2.27% in FY2013 from 3.46% in FY2012.

Looking at the GDP figures from expenditure category, it is evident that the economy is overwhelmingly consumption based and imports are rising fast (net exports is expanding on the negative side). No surprise where the remittances are going.

Meantime, while gross domestic savings are declining (down from 14.47% of GDP in FY2011 to projected 9.34% of GDP in FY2013), gross national savings are increasing rapidly (up from 28.56% of GDP in FY2006 to projected 38.41% of GDP in FY2013). Imports of goods and services are projected to reach a record 38.79% of GDP. Exports of goods and services are projected to be just 10.34% of GDP.

Friday, April 5, 2013

Links of Interest (2013-04-05)

Links of interest series is back again. Below are links (and excerpts) to some of the interesting papers and articles.

Does gender inequality hinder development and economic growth?

[The evidence is not conclusive, i.e. a definitive causal link between inequality and growth is not established yet. But, this doesn’t mean “imply that inequality-reducing policies are ineffective.”]

Economics versus Politics: Pitfalls of Policy Advice

[Acemoglu and Robinson argue that “sound economic policy should be based on a careful analysis of political economy and should factor in its influence on future political equilibria.”]

Cash transfers and child schooling : evidence from a randomized evaluation of the role of conditionality

[Akresh, de Walque and Kazianga: “The results indicate that unconditional and conditional cash transfer programs have a similar impact increasing the enrollment of children who are traditionally favored by parents for school participation, including boys, older children, and higher ability children. However, the conditional transfers are significantly more effective than the unconditional transfers in improving the enrollment of "marginal children" who are initially less likely to go to school, such as girls, younger children, and lower ability children. Thus, conditionality plays a critical role in benefiting children who are less likely to receive investments from their parents.”]

Trends in developing country trade 1980-2010

[Michalopoulos and Ng: “This paper reviews trends and patterns in developing countries' trade from 1980 to 2010. During the 30-year span, world trade expanded rapidly, especially in developing countries in the last decade. A similar picture emerges in trade in services. These overall trends, however, mask different trade patterns during some of the time periods and among different developing countries and groups. For example, except for Asia, the 1980s were pretty much a "lost" decade for many developing countries and groups. But that changed in the 1990s and 2000s, with trade by all major developing countries growing faster than developed countries. From 1980 to 2000, trade by Least Developed Countries grew much more slowly than that of developing countries as a whole. But those countries saw the fastest growth in trade in the following decade. This strong overall trade performance -- with some exceptions (for example Sub-Sahara Africa in the manufacturing trade) -- raises questions about sustainability, trade policy and the architecture of the trading system.”]

Does access to finance matter in microenterprise growth ? evidence from Bangladesh

[Khandker, Samad and Ali: “The findings suggest that households engaged in microenterprise activities, in addition to farm and other nonfarm activities, are much better off (in terms of income, expenditure and poverty) than those not engaged in such activities. Fewer than 10 percent of the enterprises have access to institutional finance (formal banks or microcredit), although the rate of return on microenterprise investments is more than sufficient (36 percent per year) to repay institutional loans. The research suggests that credit constraints may reduce the enterprises' profit margin by as much as 13.6 percent per year. As the returns to microenterprise investment are found to be high, microfinance institutions can play a larger role in supporting microenterprise growth in Bangladesh.”]

A brighter future for renewable energy with private sector involvement in Nepal

[ Friis Bach and Pokharel write: “The National Rural and Renewable Energy is innovative as it seeks to realize the great scope of credit financing of renewable energy. The private sector and public-private partnerships are keys to the success of the program. The public sources and development assistance is simply not enough, if we want to ensure universal access to sustainable energy. At the same time, there should be a sound profit to earn for private sector, if they engage in new models for financing investments in renewable energy. The Government of Nepal and development partners have therefore agreed to establish a new Central Renewable Energy Fund (CREF) mechanism–the CREF to be handled by a bank–with an estimated budget of US $ 115 million for the next five years. We are not creating a new institution, but buying into existing commercial and development banks, which is more efficient and sustainable. Through subsidies and credits, the CREF will facilitate bankable renewable energy solutions to rural Nepal on an even larger scale. Once established and proven as an effective financing mechanism for the sector, it is expected that further funds will be committed to CREF, from public, development and private sources.”]

Thursday, April 4, 2013

Nepal-India Trade: State of tariff barriers

[This blog post is sourced from one of the studies (workshop presentation slides here) yours truly was involved in about a year ago while working at SAWTEE. I think sharing analytical excerpts from the comprehensive report will be helpful to interested readers and researchers. This blog post focuses on tariffs on Nepali exports to the Indian market. Here are earlier blog posts on the issues surrounding pegged exchange rate between Nepal and India; the confidence on the Indian rupee in Nepal; and the size of Indian market for Nepal.]


State of tariff barriers

According to the trade treaty between Nepal and India signed on 27 October 2009, there are virtually no tariffs imposed on most of the Nepalese exports to India.[1] The import of vegetable fats, copper products, acrylic yarn, and zinc oxide are subject to annual quotas. The import of alcoholic liquors/beverages (except industrial spirits[2]), perfumes and cosmetics with non-Nepalese/non-Indian brand names, and cigarettes and tobacco are not allowed preferential entry into India.


The applied ad valorem equivalent (AVE) tariffs[3] are between 0.01 percent and 22.69 percent on nine of the total product categories at HS2007 2-digit classification (see Table 1). At the HS2007 6-digit level, estimated applied tariff of up to 75 percent is slapped on 25 different products. The highest tariff is on liquors and spirits (product code 220870 and 220820 respectively), estimated to be AVE equivalent tariffs of 75 percent and 50 percent, respectively.


Table 1: Applied ad valorem equivalent tariffs on Nepalese exports to India (HS2007 2-digit level) in 2009

Product codes
Product description
Number of tariff lines
Total AVE tariff (estimated)
'24
Tobacco and manufactured tobacco substitutes
44
22.69%
'22
Beverages, spirits and vinegar
64
4.98%
'18
Cocoa and cocoa preparations
15
4.48%
'74
Copper and articles thereof
95
0.87%
'33
Essential oils and resinoids; perfumery, cosmetic or toilet preparations
124
0.53%
'15
Animal or vegetable fats and oils and their cleavage products; prepared edible fats; animal or vegetable waxes
119
0.08%
'54
Man-made filaments
244
0.04%
'28
Inorganic chemicals; organic or inorganic compounds of precious metals, of rare-earth metals, of radioactive elements or of isotopes
327
0.01%
'85
Electrical machinery and equipment and parts thereof; sound recorders and reproducers, television image and sound recorders and reproducers, and parts and accessories of such articles
594
0.01%
All others
0.00%
Source: ITC’s Market Access Map (data for the latest year available)

In general, India's tariffs are higher for agriculture goods and processed goods than for semi-manufactures. The tariff structure in India for fiscal year 2010/11 is summarized in Table 2.

Table 2: Tariff structure, 2006/07 and 2010/11 (%)


Tariff category
MFN effective applied rates
Final bound
rate
a
2006/07
2010/11
1.
Bound tariff lines (% of all tariff lines)
75.2
75.6
75.6
2.
Simple average rate
15.1
12.0
46.4

Agricultural products (HS01‑24)
38.2
35.1
119.1

Industrial products (HS25‑97)
11.8
8.6
33.7

WTO agricultural products
36.2
33.2
118.3

WTO non‑agricultural products
12.0
8.9
32.0

Textiles
12.2
9.6
26.9

Clothing
12.5
10.0
37.1
3.
Duty free tariff lines (% of all tariff lines)
2.7
3.2
1.9
4.
Domestic tariff "peaks" (% of all tariff lines)b
2.5
2.2
6.5
5.
International tariff "peaks" (% of all tariff lines)c
12.5
11.9
87.7
6.
Overall standard deviation of tariff rates
15.0
14.2
40.8
7.
Coefficient of variation of tariff rates
1.0
1.2
0.9
8.
Non‑ad valorem tariffs (% of all tariff lines)
6.1
6.1
8.0
9
Nuisance applied rates (% of all tariff lines)d
0.5
0.7
0.0
a    Based on 2010/11 tariff schedule.  Implementation of final bound rates was completed in 2005.  Calculations are based on 8,567 bound tariff lines, of which 8,503 are fully bound and 64 partially bound.
b    Domestic tariff peaks are defined as those exceeding three times the overall simple average applied rate.
c    International tariff peaks are defined as those exceeding 15%.
d    Nuisance rates are those greater than zero, but less than or equal to 2%.
Note:    The 2006/07 tariff is based on HS02 nomenclature, consisting of 11,695 tariff lines;  the 2010/11 tariff is based on HS07 nomenclature consisting of 11,328 tariff lines.  Calculations exclude specific rates and include the ad valorem part of alternate rates.  MFN applied rates include exemptions, applicable at the full eight digit tariff line
.
Source: WTO. 2011. Trade Policy Review India: Report by the Secretariat. Trade Policy Review, Geneva: World Trade Organization (WTO).

India grants preferential tariff rates for certain articles under Global System of Trade Preference (GSTP), regional,[4] and bilateral agreements[5]. Under the GSTP, India has granted tariff concessions to 12 countries on a limited number of products. Only preferences under the SAFTA II (at 2.3%) and under the Sri Lanka FTA (at 2.3%) are significantly lower than the simple average applied MFN of 12% (See Table 3).

Table 3: Summary analysis of preferential tariff, 2010/11
 
a   The 2010/11 MFN tariff consists of 11,328 tariff lines, of which 359 are duty free. The number of preferential lines includes only lines on which the rates, at fully applied eight‑digit level, are lower than the corresponding MFN applied rate.
b   Preferential rates for Pakistan and Sri Lanka.
c   Preferential rates apply to SAFTA LDC members: Bangladesh, Bhutan, the Maldives, and Nepal. For Bangladesh, duty‑free in‑quota rates apply to textiles.

Source: WTO. 2011. Trade Policy Review India: Report by the Secretariat. Trade Policy Review, Geneva: World Trade Organization (WTO).
 

[1] The official provisions concerning export of goods are related to tariffs (on the negative list items), rules of origin and safeguards.
[2] Nepalese beer can be exported to India on payment of the applicable liquor excise duty equal to the effective excise duty as levied on Indian beer.
[3] An ad valorem equivalent (AVE) tariff is a tariff presented as a percentage of the value of goods cleared through customs.
[4] These are: Agreement on South Asian Free Trade Area (SAFTA), Asia Pacific Trade Agreement (APTA, also known and Bangkok Agreement), Southern Cone Common Market (MERCOSUR), and Association for South East Asian Nations (ASEAN).
[5] These are bilateral agreements with Chile, Singapore, South Korea, and Sri Lanka.