Showing posts sorted by relevance for query growth report. Sort by date Show all posts

Thursday, May 22, 2008

CGD's The Growth Report 2008

The Commission on Growth & Development (CGD) has released The Growth Report: Strategies for Sustained Growth and Inclusive Development, arguing that developing countries can achieve fast, sustained, equitable growth if they engage with the global economy and have committed leaders.

Key findings:


--Fast, sustained growth is not a miracle – it is possible for developing countries, as long as their leaders are committed to achieving it and take advantage of the opportunities provided by the global economy.

--Developing countries also need to know the levels of incentives and public investments that are needed for private investment to take off in a manner that leads to the long term diversification of the economy and integration into the global economy.

--Spence argues: “The Growth Report also kills off once and for all the misguided notion that you can lift people out of poverty in the absence of growth. Growth can spare people en masse from poverty and drudgery. And with India needing to grow at a fast pace for another 13-15 years to catch up to where China is today, and China having another 600 million people in agriculture yet to move into more productive employment in urban areas, growth will lift many more people out of poverty in the coming decades.”

--Actions recommended by the Report to combat food price rises (once the current emergency situation is dealt with) include an end to export bans; more effective safety nets and redistribution mechanisms to protect people vulnerable from sudden shifts in prices; and a revitalization of infrastructure investment for agriculture. The Report also urges that policies that favor bio fuels over food be reviewed and, if necessary, reversed and that reserves and inventories be accumulated to relieve temporary shortages.


--The Report calls for establishing a mechanism to coordinate the policies of the growing number of influential countries and to safeguard the stability of the global financial system. Given the increasing economic importance of new global players, the document argues for a rebalancing of global responsibilities and representation.

--Just as the current credit crunch is affecting advanced economies, the Report also stresses the importance of a strong financial system in developing countries and argues for careful supervision of the banking sector to prevent banks expanding credit too far, and the removal of capital controls only in step with the financial market’s maturity.

--That growth is a crucial part of poverty reduction and the improvement of people’s lives. It is impossible for poor countries to lift large populations out of poverty without growth. Equality of opportunity and a focus on individuals and families, gender inequalities, and economic security, however, is critical to maintaining the support for growth oriented policies.

-- That growth is a long-term challenge that requires leadership, persistence, stamina, pragmatism, transparency and the support of the population.

-- That growth requires engagement with the global economy to import knowledge and technology, to access markets, and to generate a strong export sector – critical in the early stages of growth.

-- That growth must be inclusive. The Report highlights the importance of sharing the benefits of globalization, providing access to the underserved, and dealing with issues of gender inclusiveness. It notes the importance of infant and childhood nutrition to avoid long-term impairment in acquiring cognitive and non-cognitive skills, ensuring that they derive greater benefit from the education system and become more effective in the workplace.

-- That resources, especially labor, must be mobile. The Report also recommends a bridging of the divide between the formal and informal labor sectors by allowing export-oriented industries to recruit workers on easier terms than prevail in the formal sector but with the same essential worker protection in the areas of health and safety, working hours and child labor. It highlights the need to better manage the migration challenge and the results of changing demographics.

-- That growth requires high rates of investment, with the Report suggesting that overall public and private sector investment rates of 25 percent of GDP or above are needed.

-- That investment in education and health are particularly important. The Commission also calls for greater research into the measurement of students’ abilities in literacy and numeracy, and increased opportunities for women in the education system.

-- That money spent subsidizing energy consumption in developing countries is often misspent. Better to invest the resources in education and infrastructure. In addition subsidies bias the capital investment in long-lived assets away from energy efficiency and may negatively bias the structural evolution of the economy, the Report says.

Recommendations:

-- That industrialized countries finance the expansion of Africa’s tertiary education to make up for Africa’s brain drain. The report also recommends that industrialized economies implement promptly the time-bound trade preferences granted to manufactured exports from African countries to help them overcome the disadvantages of being late starters.

-- In small states, the Growth Report recommends greater regional economic integration, and a spreading of the burden of public services, through partial union, helping reduce the high per capita costs of effective government. Good governance is also an important foundation on which regional cooperation and multinational integration can build, the Report says.

-- Better governance in resource-rich countries, and more balance and transparency between the returns to the entities exploiting the resources and the governments in resource-rich countries.

-- And increased investment in higher education and innovation as economies transition from middle income to high income status.

Wednesday, June 4, 2008

Wolf on Easterly's criticism of the Commission on Growth and Development's The Growth Report

Wolf says Easterly is kind of wrong in his assessment:

[...]Contrary to what Prof Easterly argues, the report makes useful contributions to policymakers’ understanding. The most important is the emphasis on growth itself, underplayed by many advisers and activists in the 1990s and early 2000s. Growth is not everything. But it is the foundation for everything. The poorer the country the more important growth becomes, partly because it is impossible to redistribute nothing and partly because higher incomes make a huge difference to the welfare of the poorest.

Yet the report goes beyond that. It is based on an analysis of 13 countries that have managed growth of 7 per cent a year over at least 25 years. They are diverse: Botswana, Brazil, China, Hong Kong, Indonesia, Japan, South Korea, Malaysia, Malta, Oman, Singapore, Taiwan and Thailand. India and Vietnam seem likely to join this group. These countries have not all sustained their growth: Brazil and Indonesia are important examples of backsliding. These countries are also different in many respects, notably in their size, resources and culture.

Yet, suggests the report, they shared five points of resemblance: they fully exploited the opportunities afforded by the world economy; they maintained macroeconomic stability; they sustained high rates of saving and investment; they let markets allocate resources; and they had committed, credible and capable governments.

These points are consistent with the so-called “Washington consensus” of the 1990s, which emphasised macroeconomic stability, trade and the market. Yet the report’s emphasis is different: it does not stress privatisation, free markets and free trade, while it does emphasise the role of the so-called “developmental state”

Beyond these principles, the report proposes “ingredients” of rapid growth. It says: “Just as we cannot say this list is sufficient, we cannot say for sure that all the ingredients are necessary. . . But we suspect that over 10 or 20 years of fast growth, all of these ingredients will matter.”

The ingredients include: investment of at least 25 per cent of gross domestic product, predominantly financed by domestic savings, including investment of some 5-7 per cent of GDP in infrastructure; and spending by private and public sectors of another 7-8 per cent of GDP on education, training and health. They also include: inward technology transfer, facilitated by exploitation of opportunities for trade and inward foreign direct investment; acceptance of competition, structural change and urbanisation; competitive labour markets, at least at the margin; the need to bring environmental protection into development from the beginning; and equality of opportunity, particularly for women.

The report also offers a pragmatic guide to some controversial debates: the role of industrial policy and export promotion; the pros and cons of deliberate undervaluation of the exchange rate; how far and how soon the economy should be open to capital flows; and the difficulties inherent in developing the financial sector.

[...]

Particularly welcome is the short list of policies to be avoided. Among them are: subsidising energy (particularly relevant today); using the civil service as employer of last resort; reducing fiscal deficits by cutting spending on infrastructure; providing open-ended protection to specific sectors; using price controls as a way to curb inflation; banning exports, to keep domestic prices low; underinvesting in urban infrastructure; underpaying public servants, such as teachers; and allowing the exchange rate to appreciate too far, too quickly.

This report, then, should be seen as a pragmatic guide to policies for accelerating growth in developing countries. What emerges is how tricky this has proved to be: it notes, rightly, how often growth has slowed once a country has achieved middle-income status. This is partly because policies and politics will, and must, change as the economy evolves.

Achieving sustained, rapid growth turns out to be very hard. Recognition of this is no objection to the report’s conclusion. It is an admission of how little we know about such a complex economic, social and political process. Yes, the report is humble. There is much for economists to be humble about. But humility should not be mistaken for total ignorance.


Thursday, November 20, 2008

World Development Report 2009

The World Development Report 2009 is titled Reshaping Economic Geography.The gist of the report: growth is unbalanced but development can be inclusive…to promote long-term growth policies should be designed to facilitate concentration and economic integration, both within and across countries. Overview of the report here. Full text Part 1 and Part 2

The report warns that trying to fight markets just because it is unfavorable to certain sectors and groups is tantamount to fighting prosperity. Let markets do its function and governments facilitate geographic concentration of production. That being said, governments should institute policies that make provision of basic needs- of schools, security, streets, and sanitation- more universal, the report recommends.

Four main points:

  • Economic activity concentrates as places prosper. (Take the fact that the effects of economic growth on concentration of industries and population is uneven. Examples: Tokyo is barely 4% of Japan’s total area but has 35 million people)
  • Living standards converge with development. (Estimates from over 100 living standards surveys show that households in the most prosperous areas of developing countries like Ghana and Indonesia have an average consumption nearly 75 percent higher than that in their lagging areas. In wealthy countries, this difference is less than 25 percent.)
  • Growth requires geographic transformations. (…what matters for economic growth is the ‘thickness’ of economic borders, which depends on the restrictions on the flow of goods, capital, people, and ideas. Borders between countries in Western Europe are now about one-fourth as thick as those in Western Africa.)
  • Prosperity demands mobile people and products. (Korea went from more than 80 percent rural to more than 80 percent urban between 1950 and 1990, as its per capita income grew from present-day Benin’s to more than Portugal’s. The United States, the world’s largest economy, is also among the most mobile, with about 35 million people changing their place of residence every year. In China, more than 150 million people moved to coastal areas during the late 1990s.)

“Lagging and leading places can be brought closer economically by unleashing the market forces of agglomeration, migration and specialization, as we have seen in North America, Western Europe, and East Asia, where intra-industry trade has powered prosperity,” said Justin Lin, World Bank Chief Economist and Senior Vice President, Development Economics. “How well markets and governments work together to harness these forces will determine the wealth of cities, provinces, and nations.”

Trying to spread out economic activity can hinder growth and does little to fight poverty. For rapid, shared growth, governments must promote economic integration which, at its core, is about the mobility of people, products, and ideas.

“In a world where economic concentration is a fact of life, governments should improve land policies, provide basic services everywhere and invest efficiently in infrastructure,” said Katherine Sierra, Vice President, Sustainable Development. “As the WDR shows, incentives intended to attract industry to lagging areas should be used sparingly.”

The WDR reframes the policy debates to include all the instruments of integration—common institutions, connective infrastructure, and targeted interventions. By common institutions, the report means regulations affecting land, labor and commerce, and social services such as education and health financed through taxes and transfers. Infrastructure refers to roads, railways, ports, airports, and communications systems. Interventions include slum clearance programs, special tax incentives to firms, and preferential trade access for poor countries.

This report is related to Nobel laureate Paul Krugman’s work on New Economic Geography and the discussion about increasing returns and transportation costs. I had written an Op-ed about how policies can be designed so that governments can facilitate concentration and agglomeration in the Nepali economy, which has seen massive concentration of industries in few places while leaving other areas at bay. My main policy recommendation in the Op-ed was: invest in transportation and infrastructure and facilitate credits to companies willing to invest in new areas. This report kind of challenges this argument saying that trying to “spread out economic activity can hinder growth and does little to help poverty”. Well, without investing in transportation, domestic integration is not possible in countries like Nepal. And, if money is invested in transportation infrastructure, then lower per unit transportation costs will help spread the concentration of industries. It does not necessarily mean that this will thin out already existing concentration.

In short, the report says: promote concentration and let markets work but also engage in welfare programs so that those unaffected by markets are taken care of. Let growth be unbalanced, but effective policies will make development inclusive. Also, the report flatly states that the world is not flat (on page 8 of extended summary)…I wonder how Thomas Friedman would review this report.

More about the report here and here.

Thursday, May 29, 2008

Easterly on The Growth Report

Easterly loathes planners. This time he blasts Michael Sepence and his team their their two year long research on finding the sources of growth. He argues that the outcome of $4m investment on Commission on Growth and Development is an inconclusive big report; their answer to high growth, as Easterly reads the report, is: "we do not know, but trust experts to figure it out."

[...]This conclusion is fleshed out with statements such as: “It is hard to know how the economy will respond to a policy, and the right answer in the present moment may not apply in the future.” Growth should be directed by markets, except when it should be directed by governments.

My students at New York University would have been happy to supply statements like these to the World Bank for a lot less than $4m.

[...]The Growth Commission correctly pointed out that such an attempt to find secrets to growth has failed. The Growth Commission concluded that “answers” had to be country specific and even period specific. But if each moment in each country is unique, then experts cannot learn from any other experience – so on what basis do they become an “expert”?

[...]The commission made the common mistake of anointing high growth rates as the measure of success, whereas high growth mysteriously comes and goes. Indeed, only two of the 13 high-growth episodes the commission studied were still going at the time of the study. Yesterday’s growth failures (for example India) are today’s successes and yesterday’s growth successes (for example Brazil) are today’s failures. Much of this volatility is inexplicable and unpredictable. To give credit to whatever leader happens to be in power during a burst of high growth is just circular reasoning (How do we know they were a great leader? Because there was high growth!).

As always Easterly blasts the WB and similar 'development expert' models. He argues that growth is accidental and unpredictable by bringing in Hayekian perspectives of serchers and spontaneous order.

What to do in a world of such unpredictability? There are some general principles and they do not require experts. Another Nobel laureate gave the crucial insight a long time ago – the answer is freedom for multitudinous individuals to figure out their own answers. Friedrich Hayek said: “Liberty is essential to leave room for the unforeseeable and unpredictable; we want it because we have learned to expect from it the opportunity of realising many of our aims. It is because every individual knows so little and ... because we rarely know which of us knows best that we trust the independent and competitive efforts of many to induce the emergence of what we shall want when we see it.”

The evidence for this vision is not found in those baffling fluctuations of growth rates, it is in the levels of development attained in the long run. Confirming Hayek, systems that give more liberty to individuals – featuring both more economic and political freedoms – are associated with much less poverty. The evidence for this comes from both history (for example old, despotic, poor Europe compared with modern, free, rich Europe) and cross-country comparisons (for example South Korea compared with North Korea, former West Germany compared with East, New Zealand compared with Zimbabwe). This alternative paradigm has a much smaller role for experts, because experts cannot direct or impose freedom from the top down (or else it would not be freedom).

I do not totally agree with Easterly and think that industrial policy and highly specific government intervention can work to rectify market failures. More here and here. More on the Growth Report here and here.

Wednesday, April 11, 2012

Rising inequality is eating up growth dividend in Asia

A latest ADB report argues that “Asia’s rapid growth is leaving millions behind, causing a widening gap between rich and poor that threatens to undermine the region’s stability.”

The striking point of the report is the estimate that another 240 million people could have been lifted out of poverty over the past 20 years if inequality had remained stable instead of increasing as it has since the 1990s. The report states that the richest 1% of households account for 6% to 8% of total income. Close to 20% of total income went to the wealthiest 5% in most countries. It has fascinating numbers on inequality of opportunity in access to education, health and public services.


Unequal access to education, health and other public services contributes greatly to growing inequalities, further hindering opportunities for the poor to raise their living standards. School drop-out rates are up to five times higher for children in the poorest families, while the chance of a poor infant dying at birth can be 10 times higher than those of a child born to a rich family.

Highly uneven distribution of new technology, infrastructure and investment is further fueling the divide, particularly between rural and urban areas, and coastal and inland provinces.

Governments need to focus on policy options for reducing inequality, the report says. These include the creation of quality jobs; increased spending on education and health; and expanding social protection including conditional cash transfers for the poor. Other key policy options include switching fiscal spending from untargeted price subsidies, such as on fuel, to targeted transfers; greater and more equitable revenue mobilization; and more investment in infrastructure to reduce imbalances between developed and lagging regions.


The ADO 2012 is silent about the case where you have low growth, but both poverty and inequality are decreasing (its Nepal’s case). The latest national poverty estimate based on the National Living Standard Survey 2010/11 (NLSS III) shows that 25.2 percent of the population lived below the absolute poverty line. Similarly, the latest US$1.25 a day poverty estimate based on data from NLSS III reveals that about 24.82 percent of the population is living below the globally comparable absolute poverty line. Furthermore, the Gini index—a popular measure of inequality—has declined from 43.83 in 2003 to 32.82 in 2010, according to WB estimates. The CBS estimated Gini index at 41.4 and 32.94 in 2003/04 and 2010/2011 respectively. Meanwhile, income or consumption of those in the middle of income deciles (i.e. middle class) has also increased remarkably. Obviously, the main factor here is remittances.

The ADB estimates that Nepal’s GDP growth would be 4.5% and 4% in FY2011/12 and FY2012/13 respectively. Inflation to be 8% and 7% in the two years and current account balance (share of GDP) to be 0.5% and 1%.

I am wondering why the ADO 2012 doesn’t discuss the low growth but declining poverty and inequality in Nepal (looks like a rare case). Also, it is a bit unsettling to not see the Nepal chapter of ADO 2012 not touching upon this issue though one of the main themes of the report is growth and inequality.

Here a synopsis of what the ADO states about Nepal’s economic scenario:


Growth slowed in FY2011 on weaker remittance inflows, a downdraft in real estate, fuel and power shortages, and continued political uncertainty. Inflation stayed hovering around the double-digit threshold, and the banking system came under stress. The outlook is for a modest pickup in growth but with some progress in bringing down inflation. Timely completion of the peace process, including an agreement on a federal structure and on a new constitution, would allow political leaders to focus on spurring growth and development.


Here is a synopsis of South Asian growth scenario:


South Asia will see growth improve a shade in 2012 to 6.6%. Growth in 2011 fell sharply to 6.4%, mainly reflecting India’s marked monetary tightening in the face of persistent inflation and slumping investment. Growth in Pakistan declined because of disastrous flooding, although Bangladesh and Sri Lanka did well on brisk exports. The pace of India’s growth is projected to edge up to 7.0% in 2012 and 7.5% in 2013, providing most of the lift for subregional growth to reach 7.1% in 2013. Pakistan’s growth will advance only slightly in both years because electricity will remain a bottleneck on the supply side. South Asia’s inflation is expected to fall from 9.4% last year to 7.7% in 2012 and further to 6.9% in 2013. Some cutbacks in the heavy fuel and electricity subsidies in most countries are expected, and will set a floor to how far inflation can fall.


Saturday, December 13, 2008

Catch-up growth

The IMF's latest Finance & Development magazine focuses on the financial crisis. Good stuff about the impact of financial crisis, its nature, and policy responses.

Nobel laureate Michael Spence chaired the Growth Commission, which recently published a The Growth Report after two years of study on the causes of economic growth. The IMF's new F&D magazine has an interview with Spence and Mohamoud Mohielden (Minister of Investment, Egypt)  about the financial crisis. Spence argues that unclogging credit market should be the first priority of Western  governments and this should be followed by "well-thought-out fiscal stimulus that has a time dimension".

Catch-up growth according to Spence:

We called it catch-up growth because of the global economy's contribution to growth—which we found was an essential element after looking at the dynamics of the successful high-growth cases. It is pretty well understood from trade theory and modern growth theory that global markets are big and a country can grow pretty fast without expanding its market share much—and if it has the terms of trade. But the other part, which is emphasized by Paul Romer and other distinguished leaders in the area of growth theory, is that catch-up growth is really about learning. It's about knowledge transfer. It's expanding your potential output based on what the economy—both the private and public sector sides—comes to have expertise in doing, and that is the catch phrase, no pun intended, for catch-up growth. This is what, we believe, more than anything else enables countries to grow at rates in the 7–10 percent range, and nobody else can do that. You can't do it in isolation and you can't do it as an advanced country with no counterexamples because you have to invent all the technology that moves the production possibility out, whereas developing economies can, at least for a period of time, import it. You have to import it and adapt it so it takes a considerable amount of ingenuity, innovation, and adaptation.

What would The Growth Report have focused on if it were published today? Obviously, financial crisis:

If we wrote the report in late 2008, we would have emphasized the volatility and insurance aspects more, because when they get out of control they produce crises. Also, we already know that such crises are debilitating for progress and growth, and do not adequately support growth policies.

Spence thinks the one key policy ingredient for high growth rate is openness to global economy. Mohielden thinks it is human capital.

In an article relevant to the present global financial crisis, this interview with Robert Shiller is quite interesting. Here is IMF's Chief Economist Olivier Blanchard on the financial crisis and policy responses required during and after the crisis.

Here is an interesting piece from real-world economics review: After 1929 economics changed: Will economists wake up in 2009?

Monday, December 1, 2014

Labor productivity and structural transformation in Nepal (plus LDCs)

The latest LDC Report 2014 focuses on the linkages between structural transformation, economic growth and human development. It argues that economic growth “must be accompanied by structural transformation and the creation of decent jobs in higher-productivity activities”. It has came up with a new term: "LDC paradox", which refers to “the failure of the MDGs to recognize the need for a policy framework that generates transformative growth, and in the inability of the LDCs to achieve structural transformation”.

The report underscores that the post-2015 agenda (Sustainable Development Goals) should focus on structural transformation of LDCs towards a modern and diversified economy (higher value-added sectors and more knowledge-intensive activities) in order to reverse the decline in labor productivity and to increase employment. It recommends three specific policy measures:

  • Resource mobilization (to generate financing for productive public and private investment)
  • Industrial policy (to direct those resources into sectors and activities that promote structural transformation)
  • Prudent macroeconomic framework/policies(to support structural transformation rather than impeding it— mainly, public investment, credit, real exchange rate, and domestic demand)

Labor productivity growth is a crucial factor in determining the pace and pattern of economic growth— essentially a structural transformation (changes in composition of output, employment, exports and aggregate demand). Labor productivity is generally higher in countries that export more manufactured and mixed goods— reflective of the structure of the economies they have. Countries with sluggish growth tend to export more food and agriculture products.

Economic performance is based on two interrelated processes: labor productivity and structural change. Labor productivity growth is determined by: (i) innovations within sectors (increases in capital, new technology and knowledge), and (ii) shift of labor across sectors (from lower to higher productivity activities). Labor productivity growth can be decomposed into growth of labor productivity by sector and the growth of employment (demographic and labor market components).

For countries like Nepal economic growth should be characterized by a dynamic transformation of sectors and employment share— as opposed to the growth being propped up by monsoon rains and remittance-induced demand for imported goods. Nepal needs to boost productivity within sectors (shifting from lower value added agriculture and services activities to higher value added activities within the sectors), and productivity across sectors (shifting production/employment structure from agriculture to industry before jumping into services sector— this is the proven path for sustained rise in income per capita).

The report decomposes aggregate labor productivity into three main components:

  • Direct productivity growth effect (changes in aggregate output per sector due to increases in productivity within sector)
  • Structural/reallocation effect (changes due to movements of labor between sectors with different levels of output per capita)
  • Terms-of-trade effect (changes due to relative output prices between sectors)

Manufacturing sector is important for higher productivity gains emanating from intersectoral reallocation of labor. Also, higher aggregate output per worker is strongly associated with higher productivity in the industrial sector, and with the transfer of workers to this sector.

Here is how Nepal stands relative to other LDCs in South Asia (and People’s Republic of China, which is not a LDC but has transformed is economy drastically within a generation’s time): 

  • Productivity gains within sectors contributed more to aggregate labor productivity growth than structural effect (this is expected because due to the lack of domestic employment opportunities there is a large-scale out migration of workers each year, contributing workers’ remittances equivalent to about 28% of GDP, which finance either the imported goods traded in services sector or nontradable activities within the sector). Bhutan had more productivity growth coming from structural/reallocation effect because of the large shift of workers to industry sector (electricity falls under this) after the hydropower boom.
  • Nepal’s labor productivity growth is low compared to the regional economies (see the dots in the above chart) .
  • In direct productivity growth effect and reallocation effect, services sector contributed the most.
  • Relocation effects in agriculture is negative, reflecting its reduced share in employment because of the shift of workers to other high productivity sectors. It shows trade-offs between employment generation and labor productivity (inverse).
  • The highest level of employment growth is registered in services sector. However, these are mostly informal in nature with severe lack of productive capacities at the firm level (low level of capital and information technology). Employment growth in services sector is broadly at the expense of gains in labor productivity. The reallocation effects (agriculture to services sectors) added to overall productivity growth because average productivity is higher in services sector (even if underemployment is high).
  • Industry sector productivity (both within and across) is considerably low (most probably due to the crippling binding supply-side constraints).

More on structural transformation in Nepal here (interested folks can follow the links within the blog post as well). Briefly, Nepal has ended up with an unusual structural transformation. Most of the GDP growth is coming from non-tradable sectors such as construction, retail and wholesale trade and real estate and housing. The demand for the services sector activities are in turn driven by public expenditure and remittances (see the rise in services sector value added while a premature deindustrialization in the chart below). Tradable sectors such as manufacturing and high-value agriculture activities are not prominent. Worse, more and more workers are shifting to informal activities in services sector until they find jobs overseas. Addressing this will be one of the major economic challenges for the Constituent Assembly II, if the country wants to realize its goal of graduating from LDC status by 2022.

Wednesday, April 6, 2011

Growth, inflation and poverty in Asia

Asia and the Pacific is poised to grow at 7.8% in 2011 and 7.7% in 2012, according to Asian Development Outlook 2011.The projected growth rates are lower than the 9% posted in 2010, but the ADB projects that the region will continue its firm recovery from the global economic crisis.

But, inflation remains a major worry. It argues that inflation will need to be carefully managed using a mix of policy measures, including more flexible exchange rate management and coordinated capital controls, rather than simply relying on tighter monetary policy. After expanding at 4.4% in 2010, consumer prices are set to accelerate further to 5.3% in 2011 before easing back slightly to 4.6% in 2012.

South Asia will maintain its recent robust economic performance with forecast growth of 7.5% in 2011 and 8.1% in 2012, following a 7.9% expansion in 2010. India's 2010 performance was particularly strong and broad-based, even with fiscal consolidation and monetary tightening, and the economy is set to strengthen further to post 8.2% growth in 2011 and 8.8% in 2012. Pakistan's devastating floods weighed on its growth performance, while the end of the conflict in Sri Lanka continued to help underpin its economic expansion. In January, the World Bank projected South Asia’s real GDP growth accelerated to an estimated 8.7 percent in FY2010-11 from 7.0 percent in FY2009-10, buoyed by very strong growth in India, which represents 80 percent of regional GDP. It projected South Asia to grow by 7.7% and 8.1% in 2011 and 2012, respectively.

More findings from the report (sourced from Real Time Economics blog):

  • Should food and oil prices rise 30% in 2011 and not fall too sharply in 2012, economies of developing Asia (China, Hong Kong, India, Indonesia, South Korea, Malaysia, Philippines, Singapore, Taiwan, Thailand) would together see a 0.7 percentage point hit to growth.
  • The same scenario of 30% increases in 2011 would add 1.7 percentage points to inflation. The projected impact would be highest in India and Singapore in 2011, where inflation would rise by more than 2 percentage points each. Oil, rather than food, would have a bigger impact on inflation.
  • ADB calculates that for every 10% increase in local food prices, the percent of poor people in Asia, calculated as living on less than $1.25 a day, goes up 2 percentage points, to 29% of the population. That’s an additional 64 million people living in poverty because of higher food prices.
  • Should local food prices go up 30%, that would increase Asia’s poor to nearly a third of the overall population, or 1 billion people.
  • South-South cooperation: Strengthening economic links between countries in the South can create new global growth that can take up the slack left by cooling demand from industrialized countries in the North, according to a special chapter on “South-South Links”. Much of the growth in South-South trade has been driven by "Factory Asia", where intermediate goods sourced from the region are assembled in the People's Republic of China and other local manufacturing hubs before being exported to final destinations in the United States and Europe. South-South trade between Latin America, Africa and the Middle East has grown rapidly but still remains comparatively small.
  • India’s growth: India's economy will remain robust over the next two years although growth is expected to moderate in FY2011 as slower external demand and tighter fiscal and monetary policies weigh on expansion, and as high oil prices remain a threat. Improved agricultural output, strong private consumption, robust investment, and a pickup in exports supported growth in FY2010. Gross domestic product in the year to March 2012 (FY2011) will expand by 8.2% down from an estimated rate of 8.6% for FY2010. For FY2012, growth is expected to bounce back to 8.8% as investment and overall economic activity pick up and as planned reforms move forward. At the same time, continued inflationary pressure, a pullback in private investment and structural obstacles present challenges going forward. Fiscal and monetary policies will also remain less accommodating than in the past as the government follows its fiscal consolidation road map and the Reserve Bank of India acts to anchor inflation expectations. The government needs to tackle structural constraints including the poor agriculture supply chain and farm productivity. A positive start has been made with programs to remove production and distribution bottlenecks for farm products and these steps should continue, the report says. Transforming manufacturing by reducing infrastructure bottlenecks and investment hurdles linked to labor regulations, land acquisition and environmental clearances should also be addressed.
  • China’s growth: Slowing investment and exports will see growth in the People's Republic of China (PRC) moderate in 2011 and 2012.the economy is likely to expand by 9.6% this year and 9.2% in 2012. It grew by 10.3% in 2010, on the back of a strong recovery in exports and a rebound in investment and consumption. Fixed asset investment will remain a key driver of growth over the next two years, the report says, although the rate of expansion is set to decelerate slightly from past levels due to the winding back of fiscal stimulus measures and tighter monetary policy. However, a moderation in export and industrial output growth will offset this somewhat as demand from major markets remains sluggish and as tax rebates on some export products expire. The inflation rate, which averaged 3.3% in 2010, will pick up to 4.6% in 2011, lifted by abundant liquidity and higher food and commodities prices, before easing back to 4.2% in 2012 as commodity prices level off. The report notes that the PRC's rapid shift from a low to middle income economy over the past three decades has been accompanied by widening income gaps, widespread environmental damage and underdeveloped services. To support inclusive and sustainable growth, the Government will need to undertake broad policy adjustments such as increased public service spending, more financial sector liberalization, develop capital markets to help small enterprises and the self-employed access credit, and increase the role of the private sector.

Saturday, November 13, 2010

Open trade plus social protection for sustained growth

A joint report (Benefits of Trade for Employment and Growth) by the OECD, the ILO, the WTO and the WB, prepared for leaders attending the G20 Summit in Seoul, states that while open trade is always good, it must be complemented by properly designed domestic policies, including employment and social protection policies to ensure that benefits from trade are widely shared. While the crisis has limited growth in many countries, this should not be a reason to go for trade protectionist policies. Instead, trade should be kept open and it should be backed up by social security policies.


The economic crisis showed how open economies are exposed to external shocks, the report adds. But openness to trade also helps economies recover more quickly as they are more adaptable and less dependent on limited domestic demand.

Trade is contributing to the economic recovery. But with high unemployment persisting in many countries, governments must resist protectionism, the organizations say. They underscored that a successful conclusion to the Doha Development Agenda would send a positive signal that governments continue to oppose protectionism and seek new opportunities for growth, development and job creation through trade.

For open trade to boost growth and jobs on a sustained basis, complementary policies to address adjustment problems and distributional concerns are needed to help workers who may lose their jobs as a result of increased international competition. Relevant measures include stable macroeconomic policies, effective labor market and social protection policies, investment in education and enhancing export sectors in developing countries.


While batting for the case of free trade, the report points out a study about NAFTA’s impact on Mexico that finds that on average a 10% reduction in tariffs led to productivity growth of 4-8%. Also, it cites an OECD (2003) study that shows that over the long term, an increase in 10% in trade exposure (trade as a percentage of GDP) was associated with a 4% increase in output per working-age person. However, this report by Eduardo Zepeda et al (2010) shows that under NAFTA, Mexico’s annual growth of GDP per capita has stagnated; there is not much change in total investment; macroeconomic vulnerability has increased; and progress in job growth has been weak. NAFTA’s promise of broad-based dynamic growth has fallen short of its stated goals. So, even if trade as a percentage of GDP increased, economic growth rate was very low. Nepal has one of the highest degree of trade openness (as a percentage of GDP), but its growth is stunted for years now. 

While the studies cited in the report are making valid points, evidence of to its contrary should also be heeded. It means that government should be thinking of why the same expected results were not seen in other countries despite similar trade openness policies. The prerequisites for translating trade openness’s positive impact on growth are missing in many developing countries. The developed countries who vouch for more trade openness should ensure that there is ample funding to institute the required prerequisites in the developing countries, who ideally would get funding based on their initiation on trade openness. There is Aid for Trade and EIF for LDCs facilities in the WTO regime. But, it looks like a sympathetic gesture to quiet the disquiet voice in trade negotiations. It should be seriously thought of in terms of sufficient funding, technology transfer, capacity building, infrastructure, etc.

Also, check out the latest simulation result of changes in employment and real incomes  following good liberalization under the assumption that the G-20 countries implement a 50% MFN tariff reduction and reduce NTB by 50% on an MFN basis. South Korea, China, India, and Thailand benefit the most in terms of increase in real income in the long run. Mexico is going to lose.

Wednesday, February 12, 2014

NEPAL: 633,000 people to enter job market annually by 2020

In its Least Developed Counties Report 2013, UNCTAD argues that the number of young people of working age in Nepal is currently increasing by 550,000 a year (465,000 in 2005), and by 2020 it will climb to 633,000 a year. Globally, young population is projected to rise to 1.7 billion by 2050. By 2050, one in four young people worldwide will live in an LDC.

The report recommends improving GDP growth via:
  • the generation of employment, particularly work that pays a stable living wage and has safe employment conditions
  • investment to develop the capacities of economies to produce broader varieties of goods, and goods of greater sophistication and higher value
The report states that employment grew by 2.7% per annum during 2000-2012, higher than the average population growth of 1.7% but below GDP growth of 4%.

Sector-wise employment breakdown shows the following:
  • Agriculture accounted for 71% of total employment, down from 75% in 2000.
  • Industry accounted for 12% of Nepal's total employment in 2013, up by 2% compared to 2000.
  • Services accounted for 17% of employment in 2013, up by 2% compared to 2000.
The figure below shows LDC’s employment elasticity to GDP growth. Nepal has elasticity below 1, which suggests that employment growth is dominated more by labor productivity growth than broad-based employment generation. Elasticity greater than 1 indicates that employment grows in more proportion than GDP growth. Employment elasticity to GDP growth in LDCs is found to average 0.7.


It seems growth in per capita GDP is accounted more for by the change in share of working age population (demographic structure) in Nepal and less by output per worker. Other developing countries have seen growth in per capita GDP coming more from productivity growth (output per worker). In Nepal, demographic transition (alternatively, decreasing dependent population) generated per capita growth equivalent to 42.8% of the actual observed growth in per capita GDP.


Furthermore, rather than within sector productivity growth, contributions to growth in per captia GDP came more from inter-sectoral shifts (structural change) in Nepal, especially from a shift to service sector. Exogenously, about 42.8% contributions came from demographic shifts. These are pretty unique to Nepal when compared to other LDCs, where growth in per capita GDP is driven largely by productivity growth within sector, i.e. moving from lower productivity to higher productivity activities within sectors (and then across sectors).


For more on Nepal's structural transformation, see this blog post and the links within.

Sunday, July 4, 2010

NTIS 2010: A Strategy Without A Comparative Advantage

My latest op-ed is about the recently released Nepal Trade and Integration Strategy (NTIS) 2010. As I argue here, there is a good deal of workable ideas in the report, which identifies 19 products that have “export potentials”. Good. Nepal desperately needed a coherent analysis of the messy trade sector so that future policies are in line under one unified theme. My biggest concern with this report is that people are wrongly trying to take it as a “constitution” for exports and integration strategy.

The report does not say if the 19 products can be exported with comparative advantage. It only says that they have “export potential” based on the product’s revenue share in Nepal’s exports basket and their overall market size outside the country. For sustainability of our exports sector, we need products that are price and quality competitive. Just identifying markets and exportable goods is not the final point. Period. That being said the report is excellent. A good contribution to escorting the directionless exports sector in the right direction.


NTIS 2010: A Strategy Without A Comparative Advantage

Recently the Ministry of Commerce and Supplies released a report, Nepal Trade Integration Strategy (NTIS) 2010, which identified products with “export potential” and market destinations for them. Six years ago a similar report – Nepal Trade and Competitiveness Study (NTCS) 2004 – was released. It did not help much in uplifting exports and diversifying export basket. The new report has reignited the hope of reviving the lost glory of Nepal’s export industry, which has nosedived since 1997.

NTIS 2010 is probably one of the most clear-cut reports so far that delves into product level analysis to identify promising exportable products and market destinations for them. But, it does not say much about the potential to export the products with comparative advantage. Just identifying markets and products does not mean much if we cannot export them with comparative advantage.

The report identifies 19 key commodities and services with ‘export potentials’ that could potentially revitalize Nepal’s export sector. The identified products are cardamom, ginger, honey, lentils, tea, noodles, and medicinal herbs/essential oils in agro-product category; handmade paper, silver jewelry, iron and steel, pashmina, and wool products in craft and industrial goods category; and tourism, labor services, IT and BPO services, health services, education, engineering, and hydro-electricity in services category. Furthermore, five more potential export products/sectors pointed out in the report are transit trade services, sugar, cement, dairy products and transformers. There are numerous recommendations for the government to fine-tune and address non tariff barriers (NTB), and to take advantage of Aid for Trade (AfT) and Trade Related Technical Assistance (TRTA) facilities offered by various international agencies.

The objective of the report sounds like an effort to seek export-led ‘inclusive’ growth strategy with the identification of key products based on Nepal’s existing production capacity. The identification is based on the change in composition of Nepal’s export basket and the growth in exports of key products between 2004 and 2008. It does not say if we can export the key products with comparative advantage. Also, there is no explanation to how the growth in exports will make development inclusive. Just promoting a few agricultural products whose production structure and capacity is not yet fully known will not lead to an inclusive trade-led growth. Nepal has to consolidate and harmonize production structure and capacity in all sectors to exploit economic of scale and to make products competitive right from factor market to product market.

If our focus is to revive the exports sector, then we should be looking for products that could be exported with comparative advantage, be it small or niche or large markets. Products with high relative comparative advantage matters more than the mere identification of exportable goods and services. The growth of revenue generated from, say, iron and steel products by 52.6 percent between 2004 and 2008 does not mean that it will continue to grow linearly in the same fashion. The export value of iron and steel products was low in 2004. During the prosperous periods before the recent economic crisis in the overseas markets, exports of this item increased sharply, leading to a high growth rate of exports revenue. It does not mean that Nepal is enjoying comparative advantage in export of this product.

A ‘product space’ analysis, which is a network of relatedness between products, is necessary to figure out what products Nepal is exporting and can export with comparative advantage. It will show how Nepal can move up the value chain, and identify potential products to successfully upgrade production facilities and technologies so that transition from the production of one comparatively advantageous good to another (“nearby” goods) is easy.

A series of product space studies show that Nepal has very few agricultural goods that could be exported with comparative advantage (see “Is Nepali export passe?” Republica, March 14, 2010). There is more proximity (connectedness) between products in the non-agricultural sector, i.e. product upgrading is easier. In fact, Nepal’s product space of 1985, 2000, and 2007 shows that the agricultural sector did not contribute new exportable product with comparative advantage both in 2000 and 2007.

The report recommends the government to pay “instant attention” to four agricultural products namely tea, lentils, cardamom and ginger. These are agro-based products, whose prices are volatile in the international market. Putting down too much emphasis on agricultural products would invite increased volatility not only in the market of specific items but the whole economy as the value added contribution of the agriculture sector is around 34 percent of GDP and it employs around 66 percent of the population. The promotion of agricultural products should be based on domestic demand, which is higher than the supply as is indicated by food deficit of 316,465 tons in 2009/10.

Less volatile are the industrial and services sectors. Nepal should lay more emphasis on these two sectors than the agricultural sector, if the main objective is to boost exports sustainably and to narrow balance of trade deficit. The agricultural products are usually of low-value added ones when compared to industrial and service sector products.

A change in export composition, based on revenue fetched by individual products, does not mean that these products have more export potential. We really don’t know if they are comparatively price and quality competitive. The change in composition of products in the export basket has not made any noticeable difference in the aggregate export revenue. The growth rate of our total exports is still declining.

That said emphasis on regional integration is commendable. India is by far the most important export destination for Nepali goods and services. Around 60 percent of total trade happens with India. Similarly, China is also an important and expanding market, which has recently offered zero-tariff facility to 4,721 exportable goods. The SAARC and MENA regions could be attractive markets apart from the US and the EU. Around 64 percent of Nepal’s total merchandise trade happens within the SAARC nations. Promoting more regional integration could help the exports sector.

NTIS 2010 is an important contribution to steer the exports sector in the right direction. However, the job is not done yet. It has just begun.

[Published in Republica, July 3, 2010, pp.6]

Tuesday, October 21, 2008

The (limited) impact of foreign investment in the Americas

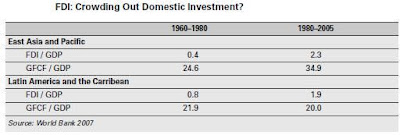
It is expected that the level of foreign investment has a direct positive relationship with stimulation of investment and hence the economy in a given investment-deficient country. Actually, in reality this depends on whether FDI acts as a complement (crowd in) or substitute (crowd out) to the level of domestic investment in an economy. (more below)

A study (Foreign Investment and Sustainable Development: Lessons from the Americas) by the Working Group on Development and the Environment in the Americas finds that foreign investment has fallen short of stimulating “broad-based” economic growth and sustainable development in Latin America. The working group studies the impact of foreign investment on economic growth, environment policy, and the political economy of Argentina, Brazil, Bolivia, Chile, Costa Rica, Ecuador, Mexico, Uruguay, and Venezuela.

They studied various regional and bilateral agreements like NAFTA, US-Chile FTA, CAFTA, US-Peru FTA, etc and looked at the impact of investment liberalization (a part of the Washington Consensus) on the Americas. What did they find? This wave of liberalization that started in the 1990s did not produce significant results as was expected. Economic growth in per capita terms in the region was slower than in the final decades of the import substitution period, according to the report.

Major findings of the report:

  • 80% of all the FDI was concentrated in Brazil, Argentina, Chile, and Venezuela.
  • Foreign firms in Mexico were export platforms to the US and those in the South America tended to sell in their own domestic market.
  • Foreign firms tended to have higher level of productivity and higher wages.
  • FDI fell short of generating spillovers and backward linkages that could help stimulation of domestic economy through emergence of local small and medium sized businesses. In fact, FDI tended to displace and kill local businesses. R&D expenditures in the host economies were not upped.
  • Environmental performance of foreign firms was mixed, sometime better and sometimes worse performance than domestic counterparts.

Note that the report does not label that the FDI’s impact on economic growth and environmental sustainability was a complete flop- it had a limited success in Latin American countries. There are cases where FDI has been a crucial factor behind rising economic growth like in China, South Korea, Bhutan, Taiwan, Malaysia, Singapore, and Mauritius, among others. The report slides in a space where there is always a trade off between growth objectives and impact on environment arising from increasing investment (both domestic and FDI). Cost is always high when considering the impact of an investment plan in an environmentally conscious manner.

Important lessons from the Latin American experience:

  • FDI is not an end but a means to sustainable development. Simply attracting FDI is not enough to generate economic growth in an environmentally sustainable manner.
  • FDI policy needs to be paired with significant and targeted domestic policies that upgrade the capabilities of national firms and provide a benchmark of environmental protection.
  • There needs to be policy space to accommodate domestic concerns in international agreements.

One of the lessons from the report is that FDI does not necessarily crowd in domestic investment. Actually, the impact of FDI on domestic investment is mixed. In Latin America, FDI has in crowed out domestic investment, as shown by this report, but in Asia (East Asia especially) and Africa, FDI has led to crowding in of domestic investment. FDI tend to be a substitute for domestic investment when there are lot of domestic firms. Meanwhile, FDI tend to be complementary when there are few domestic firms (whole sorts ancillary firms will emerge because of R&D and knowledge spillovers from MNCs). The existence of backward and forward linkages from the establishment of foreign investors is a key consideration for determining the total impact of FDI on capital formation.

Background working papers leading to the report are available here.

Wednesday, May 28, 2008

The Growth Report on Asia

  • Nine of the 13 countries that have been successful in achieving sustained high growth are from Asia: China, Hong Kong (China), Indonesia, Japan, Korea, Malaysia, Singapore, Taiwan (China) and Thailand.
  • These nine high-growth countries all share common characteristics: engagement with the global economy, macroeconomic stability, high rates of saving and investment, the market allocation of resources, and credible and capable governments.
  • Many of these Asian economies (Hong Kong, Japan, Korea, Singapore, and Taiwan) grew all the way to high-income levels.
  • The region seems to be able to anticipate and change its policies on growth, Korea’s evolution from labor-intensive manufacturing to a more knowledge-based and capital-intensive economy being one example.
  • Asia’s saving rates are seen as a strong engine for growth, with many Asian countries having saving rates 20 percentage points higher than Latin American countries, for example.
  • High savings rates in Asia are due to macroeconomic stability, fewer dependents to take care of, and more direct measures, such as mandatory saving schemes.
  • Foreign Direct Investment and the transfer of knowledge are very successful in Asia, one example being Malaysia, which has attracted multinationals to its three electronics clusters.
  • Public investment in infrastructure is also viewed as a hallmark of many Asian economies accounting for 5 to 7 percent of GDP or more.
  • Resource mobility is also seen as key, with governments not resisting the market forces that pull people into the urban areas. In Malaysia, agriculture’s share of employment fell from 40% in 1975 to 15% in 2000.
  • Growth requires committed, credible and capable governments. Reform teams in countries, such as Singapore, Japan and Korea, were able to chart a program for growth.

Recommendation for Asia:

  • Establishing a mechanism to coordinate policies of the growing number of influential countries – particularly in Asia - and to safeguard the stability of the global financial system.
There is good event on discussion about about the report at PIIE (organized by CGD). The full report is here. It would be interesting to hear what Hausmann and others have to say about this big report. Here is what Larry Summer has to say about similar report launched earlier.

Tuesday, April 11, 2017

Sustaining high growth rate in Nepal

It was published in The Kathmandu Post, 10 April 2017.


The prospect of a rosy economic outlook for FY2016-17 dominated headlines and discussions over the past two weeks. Some political analysts and commentators were quick to attribute the cautiously optimistic outlook to the work of the coalition government. Targeting the upcoming local elections scheduled for May 14, the major political parties will construct narratives around this rosy economic scenario to best suit their agenda. 

However, before being carried away by the party-centred narratives, it is necessary to note that such economic forecast is always conditional on key factors moving in the intended direction. It is also necessary to distinguish between autonomous drivers of growth and the ones that can be directly attributed to the government’s efforts. Importantly, the focus should be on implementable strategies to sustain a high growth rate. 

Bright prospects

The previous government had set a target of 6.5 percent for gross domestic product (GDP) growth and 7.5 percent for inflation in the FY2017 budget speech. Considering the dip in economic activities in the FY2016 that resulted in a GDP growth of only 0.8 percent, the target was ambitious but not entirely impossible given the expected large base effect and favourable monsoon rains. In general, base effect refers to the tendency of achieving an arithmetically high rate of growth when starting from a very low base. Hence, simply the normalisation of economic activities disrupted by the crippling embargo and the lingering impacts of the earthquakes would have generated a high growth rate. 

In its 2017 Article IV consultation report, the International Monetary Fund (IMF) revised its growth forecast showing an increase of 5.5 percent. Similarly, in its biannual Macroeconomic Update, the Asian Development Bank (ADB) also made an upward revision of its earlier forecast and estimated GDP growth to hover between 5.2 and 6.2 percent. On an average, it expects GDP growth to be around 5.6 percent.


Meanwhile, the Central Bureau of statistics (CBS), the official government agency in charge of national account estimates, will release its own provisional growth estimate later this month by analysing available data up to the first seven to eight months. The CBS will revise its FY2017 growth estimate in the next fiscal year and then finally provide an actual estimate in FY2019. A general trend is that the actual estimate is lower than the provisional estimate. A GDP growth of over 6.1 percent will be the highest since the FY1992.

Although the point estimate is slightly different among these agencies, the underlying reasons for the upward revision of growth forecasts are similar. The events observed in the first seven months or so and the expected direction of key factors in the remaining five months form the basis for such forecasts.

First, the above average monsoon rains and timely availability of chemical fertilisers have resulted in a bumper agricultural output, which according to the Ministry of Agricultural Development will be at record levels. It constitutes about 33 percent of GDP and is a significant driver of GDP growth. While monsoon rains are beyond the government’s control, a smooth supply of chemical fertilisers and, to some extent, maintenance of irrigation facilitates are definitely affected by its actions.

Second, industrial output, which registered a negative growth last year, is expected to be robust. The modest increase in capital spending (in level but not in absorption rate) and post-earthquake reconstruction activities will boost mining and quarrying as well as construction activities. Furthermore, the substantial improvements in electricity supply and its management and a favourable investment climate thanks to the notable work of the Ministry of Energy and the Ministry of Industry respectively will significantly boost manufacturing activities.

Finally, the addition of electricity from small hydropower projects as well as some improvement in the collection and distribution of water will boost growth of the electricity and water sub-sectors. These four sub-sectors collectively constitute the industrial sector, which is expected to grow at one of the highest rates in recent decades. This is where this coalition government’s actions are most visible and commendable.

Third, services output, which constitutes about 52 percent of GDP and has been the most stable and largest contributor to growth, is expected to be higher than the last two years, but not as high as in FY2014. The main reasons are the deceleration in remittance inflows and expectations of political instability in the Tarai region.

These headwinds will likely be offset by tailwinds expected from the normalisation of supplies and tourism activities, local elections-related expenses and a slight uptick in demand following the disbursement of housing grants in the last two quarters. Although the government’s direct contribution in services sector growth is marginal, it is nevertheless visible from its performance in the sub-sectors of education, public administration, defence and health care. The proactive role played by the Ministry of Health under Gagan Thapa will be especially noticeable in the improved performance of the health sub-sector.

Government’s contribution

Overall, the most notable contributions of this coalition government are that it gave continuity to the contentious budget introduced by the previous government and then made commendable efforts to reinvigorate economic activities— especially through stable electricity supply, acceleration of post-earthquake grant disbursement, nudging the line ministries to scale-up the pace of capital spending (including Melamchi project related works), improving investors’ confidence and making remarkable improvement in the health sector.

That said, a larger contribution to the overall growth will still come from two key exogenous factors: monsoon rains and remittance-backed demand in the services sector. Optimistically higher growth would depend on the government’s efficacy in budget execution and fewer hassles in administrative procedures in the remaining months.

This sort of seemingly one time spurt in growth does not mean that the economy has changed its structure and will sustain high growth in the coming years. We are miles away from reaching a stage where we can sustain a high growth rate and bring about a rapid and meaningful economic transformation. The favourable monsoon rains and remittance-backed demand of imported goods are the default factors that help maintain an average growth of about 4 percent. Achieving and sustaining growth of over 7 percent requires consistent and committed political leadership, a competent bureaucracy and inclusive institutions.